Meet AI CFO: instant what-ifs, real accuracy
Blog
January 17, 2026
January 18, 2026

Accounting Dashboard Guide & How to Build Pro Financial Dashboards

Alyona Mysko
Founder of Fuelfinance | building the future of finance for SMBs
January 18, 2026

Do you find yourself spending days trying to figure out why your cash flow doesn't match what your accountant said? You probably have QuickBooks running, a fancy profit and loss report sitting in your inbox, and due dates piling up, and still can't answer the basic question: "Are we actually making money?"

The problem isn't your accounting software — it’s that basic accounting metrics only tell you a brief summary of what happened without saying what it means for your business.

If you're tired of staring at static reports that are more confusing than telling, this guide will show you how to build an accounting dashboard that actually helps you run your company and make better decisions. We'll cover what makes these financial dashboard examples different from traditional reports, the essential financial KPIs every business needs to track, and how to set up a system that delivers real-time insights without the usual spreadsheet gymnastics.

What is an accounting dashboard?

An accounting dashboard is a visual interface that pulls real-time financial data from your business systems and displays it as a summary of charts, graphs and key performance indicators. Unlike traditional accounting reports that show historical snapshots, a modern finance dashboard gives you a detailed overview and real-time view of your business finances.

The difference comes down to speed and context. Your monthly profit and loss summary tells you what revenue you generated last month. Your accounting dashboard shows you today's revenue, compares it to your plan and highlights whether you're trending above or below your targets.

Key components of modern accounting dashboards

Most professional finance dashboard examples include a summary and share common elements that transform raw accounting data into actionable insights:

  • Data visualization elements like charts and bar graphs make complex financial information digestible at a glance. Instead of scanning rows of numbers, you see charts with trends, patterns and outliers immediately and can analyze them quickly.
  • KPI monitoring capabilities track the accounting metrics that matter most to your business. Cash flow, accounts receivable aging, profit margins, expenses and other critical indicators get prominent placement and automatic updates as new data flows in.
  • Alert and notification systems flag unusual activity or concerning trends. Whether it's a spike in expenses, overdue invoices piling up, or cash flow dropping below safe levels, the dashboard alerts you before small issues become big problems.
  • Customization and filtering options let you adjust the view based on time periods, business units or specific key metrics. You can drill down into detailed data when needed or step back to see and analyze a clear snapshot across multiple sources.

Do you need accounting dashboards?

The short answer is yes, if you want to analyze and make decisions based on current data instead of guessing.

  • Business owners and executives benefit most because they need to understand company performance without getting lost in accounting details. A good CFO dashboard shows revenue trends, cash position, due dates and profitability in a format that's easy to grasp during busy days.
  • Finance teams use dashboards to monitor daily operations, track KPIs, and prepare reports faster. Instead of manually pulling data from multiple sources, they get automated updates that feed into their automated financial reports.
  • Department managers and stakeholders need visibility into budgets, expenses, spending and performance without accessing the full accounting system. Dashboards provide controlled access to relevant data without rows and rows of numbers.
  • External partners and investors want regular updates on business performance. Professional dashboards are pretty much investor-ready presentations, but ones that don’t need hours of manual preparation.

Essential KPIs & metrics for accounting dashboards

The best accounting dashboards focus on accounting metrics, like accounts receivable or accounts payable, that directly impact business decisions. Here are the key financial KPIs you should track:

  1. Cash flow and cash position show how much money is moving in and out of your business, plus your current liquid position. This includes cash flow projections for the next 30, 60 and 90 days, which are often more important than historical profit numbers.
  2. Accounts receivable aging breaks down and analyzes outstanding invoices by how long they've been unpaid. Accounts receivable data helps you spot collection issues early and manage cash flow more effectively.
  3. Accounts payable management tracks money you owe suppliers and vendors, including due dates and payment schedules. Good visibility of accounts payable prevents late fees and helps maintain strong vendor relationships.
  4. Revenue and profit margins show both top-line growth and bottom-line efficiency. Track gross margin, net margin and contribution margin by product line or service to understand which parts of your business are most profitable.
  5. Monthly recurring revenue (MRR) for SaaS companies provides better insight than traditional revenue metrics. Combined with churn rate and expansion revenue, monthly recurring revenue gives you a clearer picture of business health and growth trajectory.
MMR formula
  1. Customer acquisition cost (CAC) and lifetime value (LTV) ratios show whether your growth is sustainable. These key SaaS metrics help you understand unit economics and make smarter marketing investment decisions for your clients.
CAC formula
  1. Unit economics and contribution margins reveal profitability at the client or transaction level. This is particularly important for subscription businesses or companies with multiple product lines.
  2. Burn rate and runway are critical for startups and growing businesses. These accounting metrics show how quickly you're spending money and how long your current cash will last at the current spending rate.
Gross and net burn rates formulas
  1. Invoice processing time and payment collection periods help identify operational inefficiencies. Slow bank invoicing or collection can create cash flow problems even for profitable businesses.
  2. Budget vs. actual variances highlight where you're performing above or below plan. This helps with budget vs actual analysis and course corrections during the year.
  3. Department-wise expense tracking shows which areas of the business are driving costs and whether expenses and spending align with planned budgets and priorities.
  4. Forecasting accuracy measures how well your predictions match actual results. Better forecasting leads to better planning and resource allocation decisions.
  5. Trend analysis indicators help identify patterns in revenue, expenses and cash flow that might not be obvious in monthly snapshots.

Recent studies show that 66% of insight-driven companies that consolidate applications and tools into one platform expect double-digit revenue growth. The companies succeeding are those that track the right key metrics for your industry and act on the data quickly.

Accounting dashboard examples

Let's look at some real-world examples to understand what effective accounting dashboards look like in practice. QuickBooks, one of the most popular accounting platforms, gives a good baseline for understanding standard dashboard functionality.

QuickBooks CFO dashboard: accounting dashboard screenshot
Source: QuickBooks

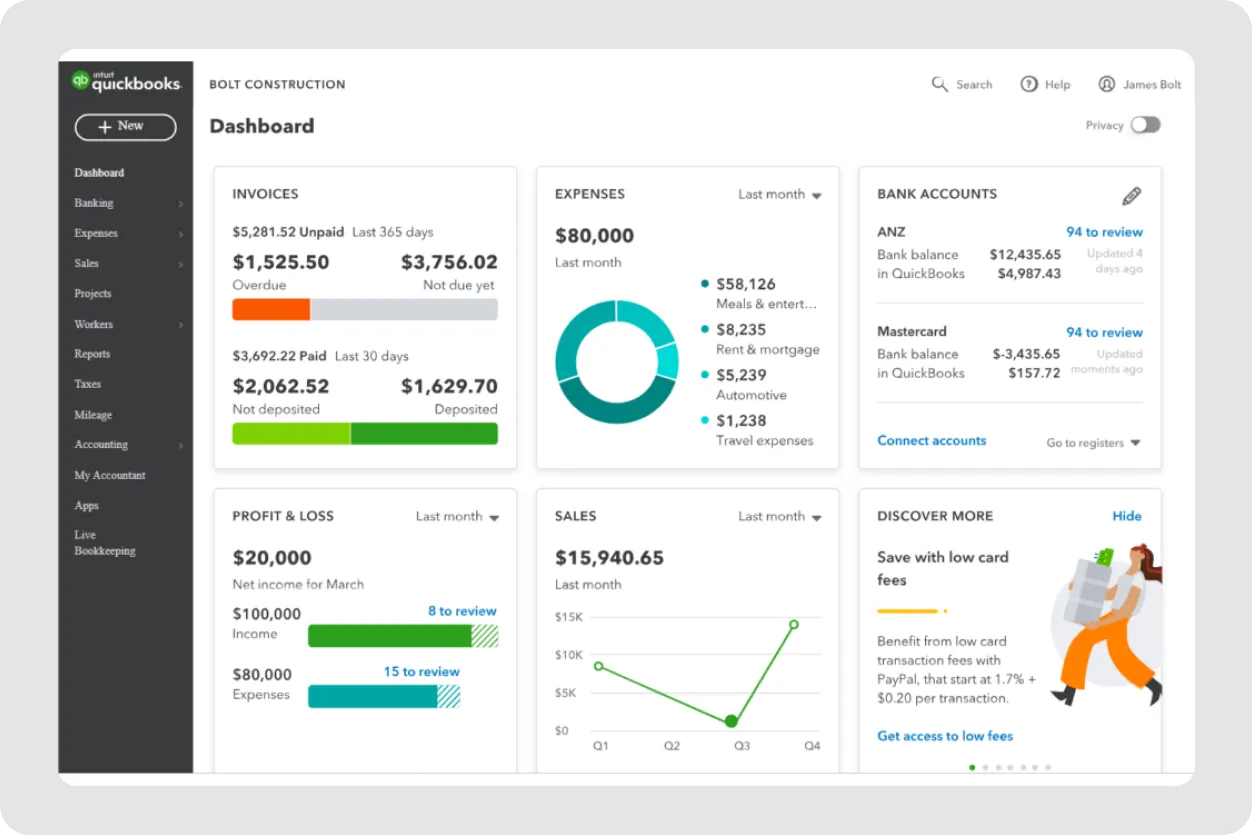
The QuickBooks dashboards show a detailed overview of basic financial health with widgets for profit and loss summaries, bank account balances and expense categories. You can see outstanding invoices, track your company's income vs expenses and get a simple visualization of cash flow trends over different time periods.

You’ll see key financial data through bar graphs, charts and summary tables that show your business's current financial position. You can monitor cash flow, track accounts receivable and see which clients have overdue invoices without digging through detailed reports.

QuickBooks online accounting dashboard tabs for invoices, expenses, and bank accounts
Source: Insightful Accountant

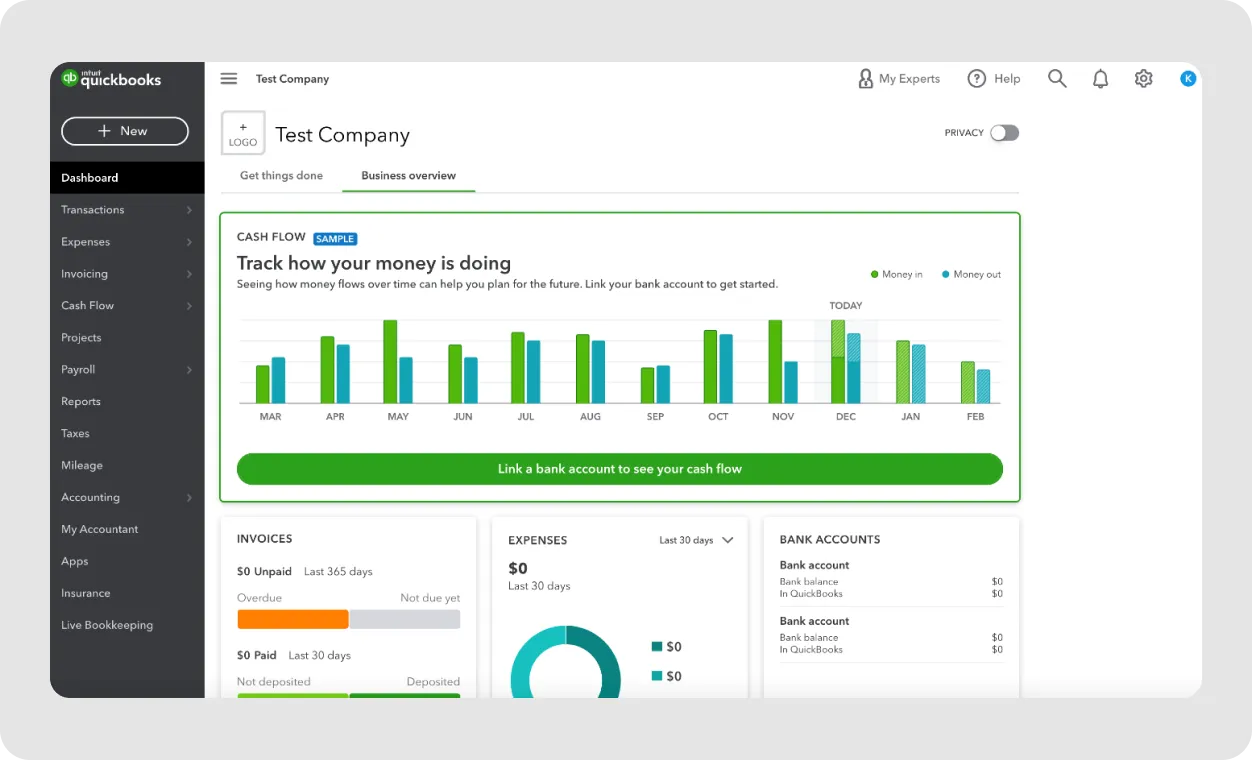
For many small businesses, this level of insight represents a significant improvement over manual spreadsheet tracking. However, as your company grows and assets increase, you start to outgrow it, and the limitations of basic accounting software dashboards start to show.

See also: Best QuickBooks Alternative for Small Businesses: 6 Top Picks

QuickBooks dashboard limitations

While QuickBooks gives you solid fundamental accounting dashboard features, it has several drawbacks that make themselves known pretty fast:

  • No option to build custom dashboards from scratch means you're stuck with the pre-designed layout and widgets. You can't reorganize the interface to match your specific workflow or highlight the metrics that matter most to your business model.
  • Limited customization capabilities limit your ability to modify charts, add company-specific KPIs or create custom views for different team members or stakeholders.
  • Manual Excel export required for complex reporting gets annoying when you need advanced analysis or want to combine accounting data with information from other business systems.
  • Lack of advanced analytics and forecasting means you're limited to basic historical reporting without the ability to model scenarios, predict future performance or identify trends that could impact your business.
  • No real-time collaboration features make it difficult for teams to work together on financial analysis or share insights across departments.
  • Limited visual customization options mean your dashboards look generic and may not effectively communicate information to stakeholders who need different levels of detail or focus.
  • Basic KPI tracking only restricts you to standard accounting metrics without the ability to track unit economics, customer cohort analysis or other advanced business metrics.

How to build advanced financial dashboards with QuickBooks + Fuelfinance

The solution isn't to abandon QuickBooks’ accounting dashboard — it's to layer it with specialized financial dashboard software that gives you actionable insights and transforms your accounting metrics into strategic business intelligence.

Fuelfinance is financial reporting software that connects directly to QuickBooks and other accounting platforms through automated data synchronization. This means your modern financial dashboard updates in real time as transactions flow through your accounting system, without manual imports or data entry.

See also: Top 6 Accounting Software Integrations for SMBs (2025 Guide)

The process starts by connecting your existing accounting tools to Fuelfinance through secure API integrations. Beyond QuickBooks, the platform supports Xero account data and over 350+ other business tools, creating a comprehensive view of your business finances.

Real-time, automatic data synchronization benefits include eliminating data entry errors, faster month-end closes and the ability to make decisions based on current information instead of waiting for monthly reports.

The dashboards provide clear, visual representations of complex financial metrics, giving you extensive insights to analyze your business health, plus forecasting capabilities and actionable recommendations. These are customized by finance experts who understand your specific industry and business model.

Fuelfinance AI forecasting analysis tool that lets you gain actionable insights about your finances

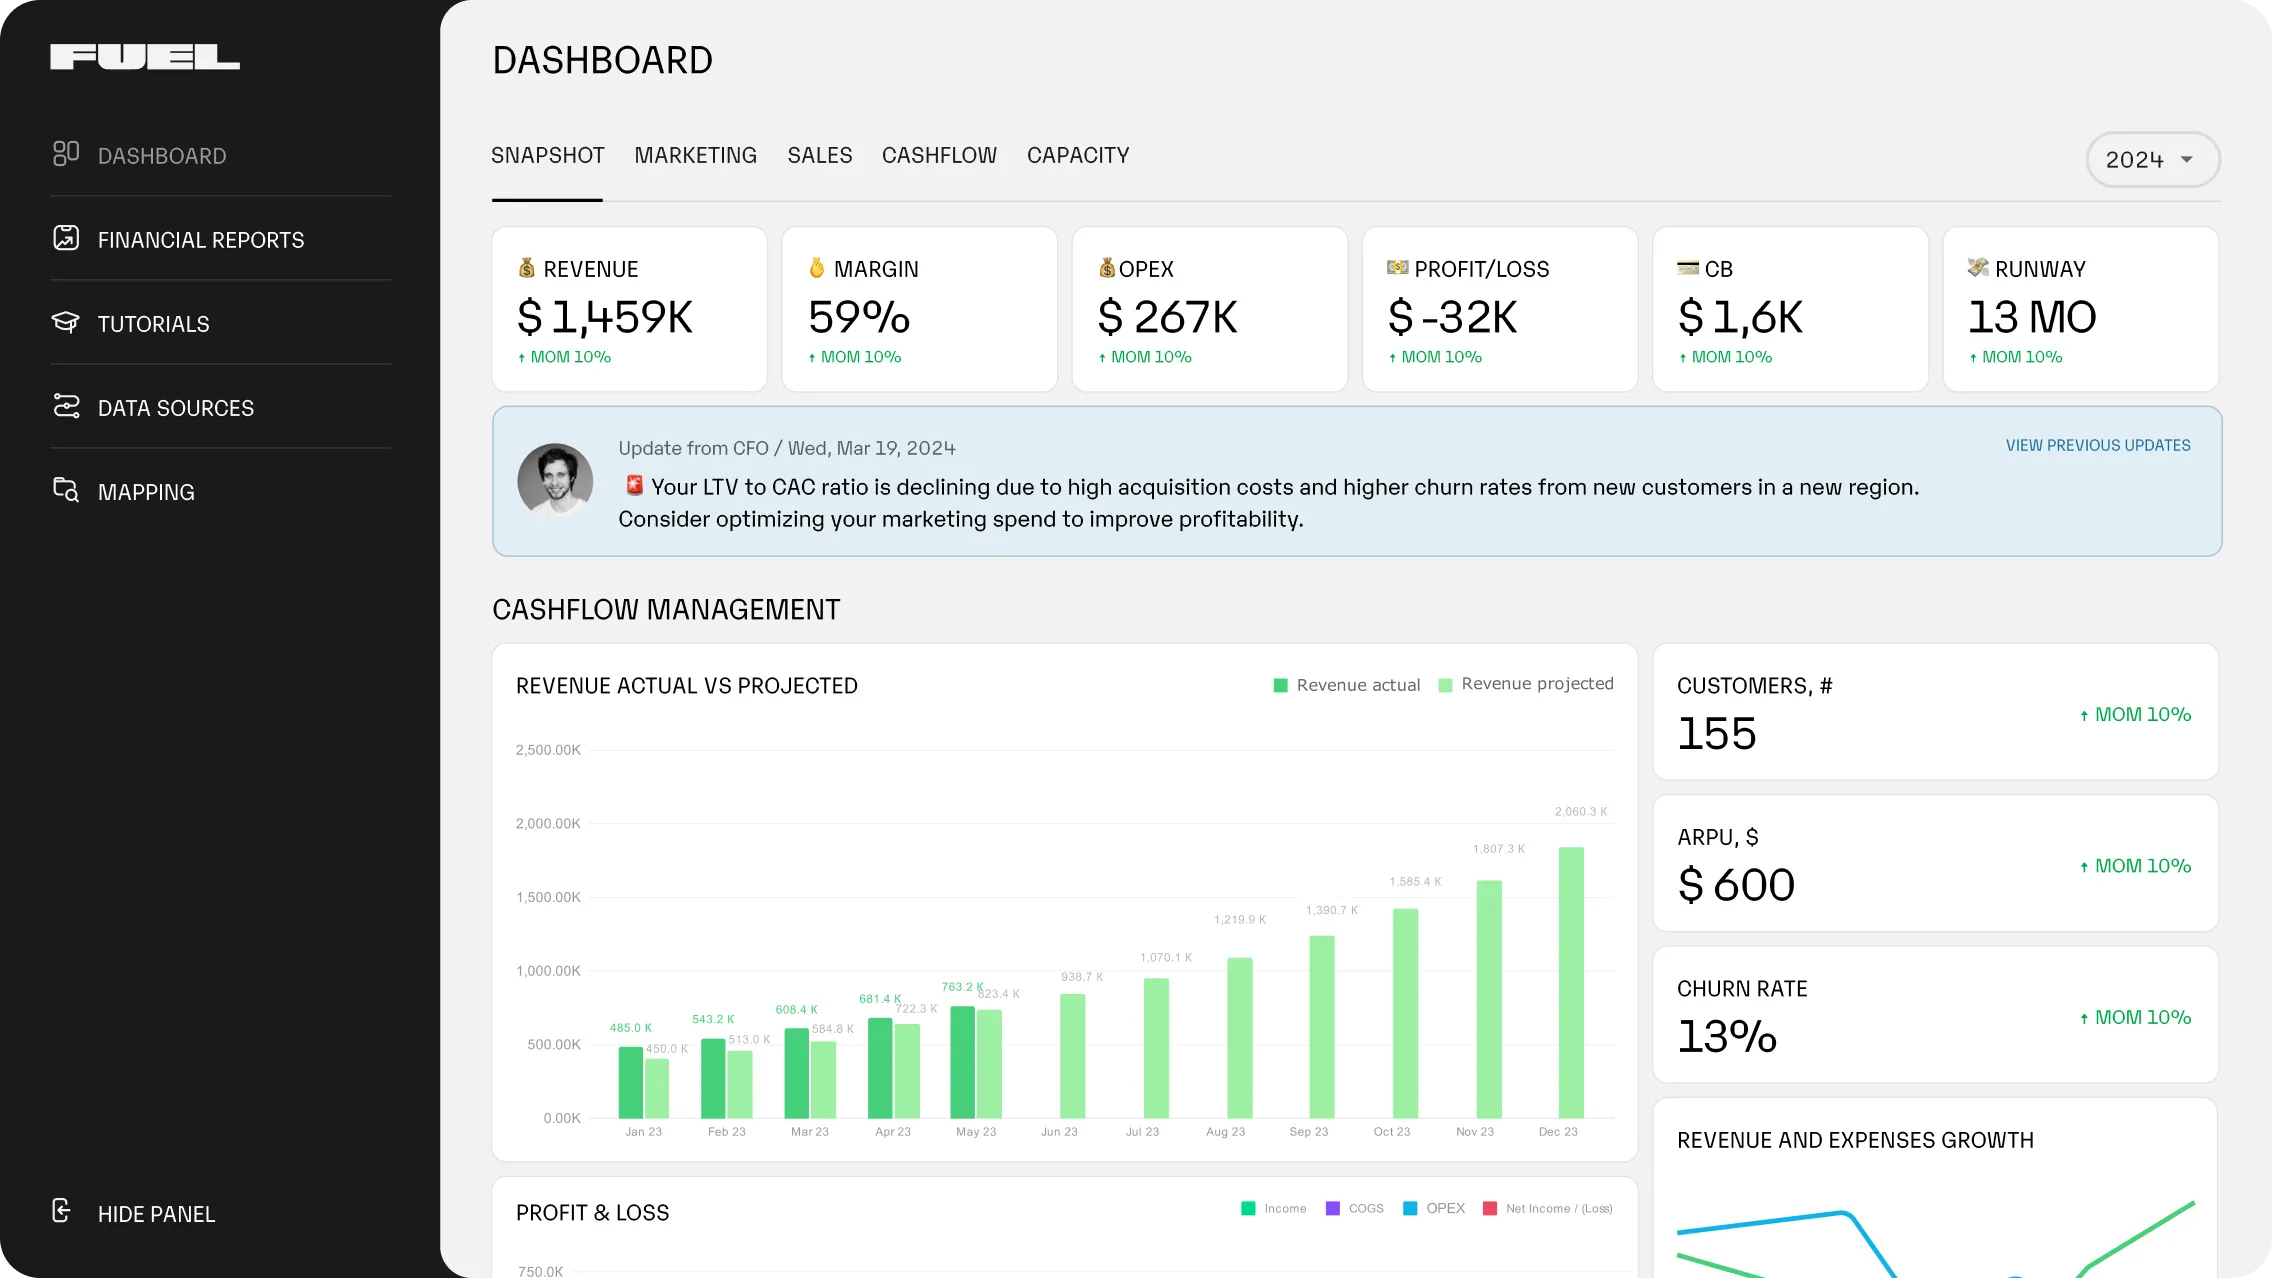
Unlike generic dashboard templates, Fuelfinance includes AI-powered financial analysis and expert financial guidance. This combination helps you understand not just what the real-time data shows, but what actions you should take based on the insights.

  • KPIs and metrics recommendations are tailored to your business type, whether you're tracking agency metrics, SaaS performance indicators, or traditional retail financial metrics.
  • No complex setup or IT requirements means you can start getting value within days, not months. The technical complexity is handled behind the scenes while you focus on using the insights to grow your business.
  • Expert financial support includes access to experienced finance professionals who can interpret your data, suggest improvements and help you understand the strategic implications of your financial trends.
  • Purpose-built for growing businesses means the dashboards scale with your company, adding new features and capabilities as your needs become more sophisticated.
  • Cost-effective compared to enterprise solutions makes advanced AI financial analysis accessible to small and medium-sized businesses that couldn't previously afford enterprise-grade financial planning software tools.
  • Continuous updates and feature releases ensure your financial reporting capabilities improve over time without requiring new software implementations.
  • Real-time financial health monitoring gives you instant visibility into cash position, revenue trends and expense patterns that help spot problems before they become critical.
  • Automated anomaly detection uses machine learning to identify unusual patterns in your financial data, flagging potential issues or opportunities that might otherwise go unnoticed.
  • Scenario planning and forecasting capabilities let you model different growth scenarios, test the impact of major decisions, and plan for various business outcomes using AI forecasting technology.
  • Investor-ready reporting templates create professional presentations for board meetings, investor updates or loan applications without requiring hours of manual report preparation.
  • Department-wise budget tracking provides visibility into spending and expenses across different areas of your business, helping you manage costs and allocate resources more effectively.

How financial dashboards can help you grow

The real value of professional financial dashboards shows up in the decisions they enable and the time they save. Companies using advanced dashboard solutions report significant improvements in both financial performance and business results.

Before switching to Fuelfinance, Testimonial Hero was managing its finances across multiple systems, including Airtable, QuickBooks and HubSpot. Before implementing an integrated dashboard solution, they spent hours each month trying to piece together their financial picture from disconnected sources.

After switching to an automated system, their profit and loss statements, cash flow reports and bank balance sheet now update in real time. They gained clear visibility into key metrics like customer acquisition cost, lifetime value and profit margins by service line.

In short, they cut their finance-related costs by 50% while gaining 2-3x more strategic value through proactive financial guidance and analysis.

Testimonial Hero CEO quote about Fuelfinance financial management

Ready for financial peace of mind?

Most business owners know their numbers matter, but few have systems that make financial data truly actionable. Basic accounting software gives you the transactions, and professional dashboards give you the insights.

If you're spending too much time gathering data and not enough time acting on it, or if your financial reports feel more like historical documents than business intelligence, it's time to upgrade your approach.

Fuelfinance combines the technical capabilities of enterprise-grade financial reporting software with the expertise of skilled finance professionals. You get automated data collection, intelligent AI analysis, a clear snapshot and strategic guidance in one integrated solution.

Ready to see what your business looks like with complete financial visibility? Book a demo with Fuelfinance and discover how the right dashboard solution can accelerate your growth.

FAQs

What is a dashboard in accounting?

A dashboard in accounting is a visual interface that displays key financial metrics and KPIs in real time. Unlike traditional accounting reports that show historical data through balance sheets, dashboards provide a summary of current insights into cash flow, profitability and business performance through charts, graphs and automated alerts.

Which accounting software has the best dashboard?

The best accounting dashboard depends on your business needs and complexity. While QuickBooks and Xero accounts offer solid basic dashboards, the best financial dashboard for growing businesses often needs more advanced features. Solutions like Fuelfinance provide enhanced financial dashboards connected to your accounting tools with AI financial analysis, forecasting and expert guidance that standard accounting software can't match.

How to make a financial dashboard?

Creating a professional financial dashboard comes down to connecting your data sources, selecting relevant KPIs and choosing visualization tools. You can build basic dashboards in Excel, but most businesses benefit from specialized financial management tools that automate data collection and provide advanced analytics capabilities.

What are the most important KPIs to include in an accounting dashboard?

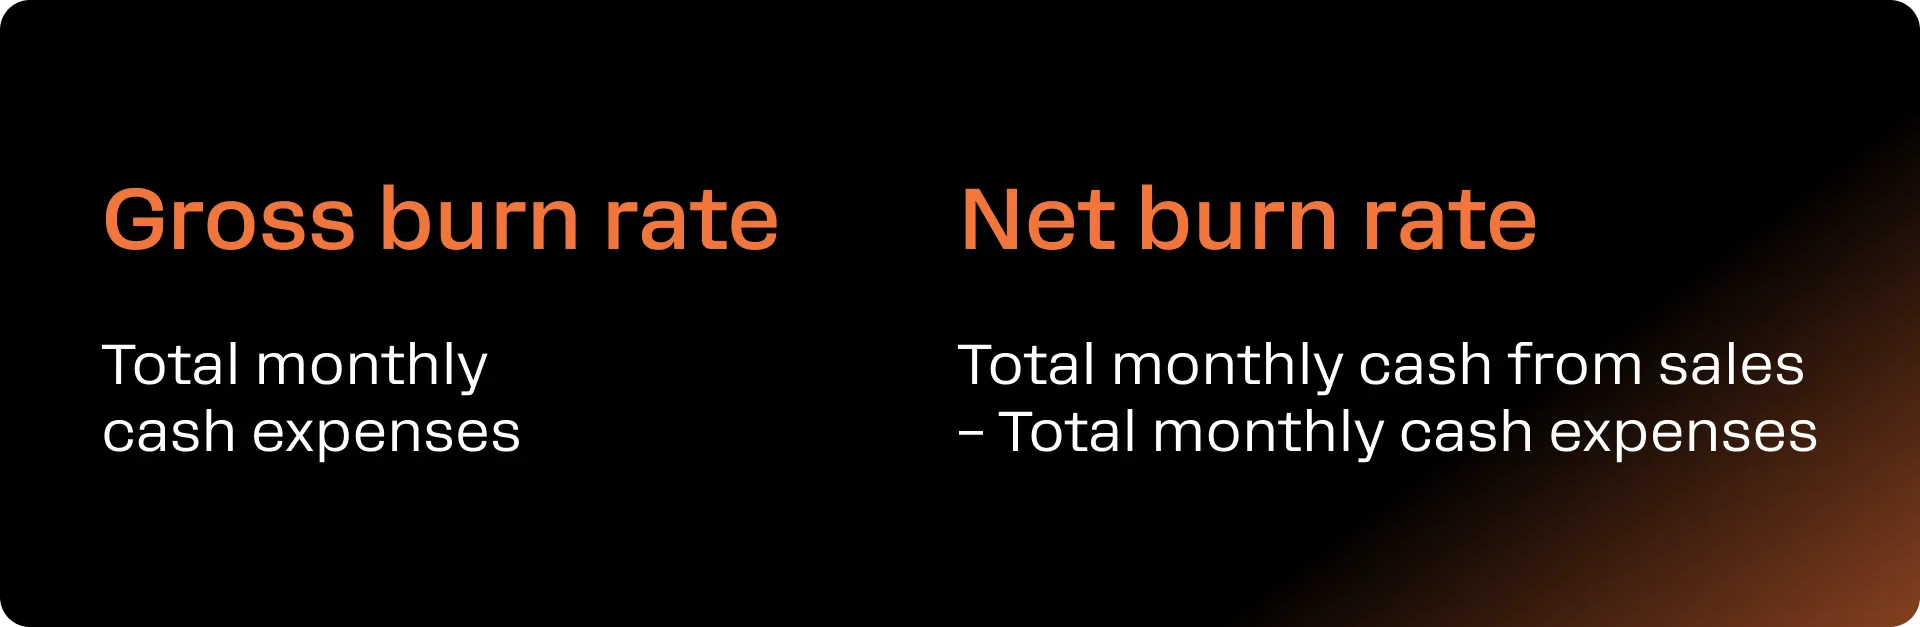
Essential KPIs for most businesses include cash flow position, accounts receivable aging, profit margins, revenue trends and burn rate for startups. SaaS companies should add MRR, churn rate and customer acquisition costs. The specific financial metrics depend on your business model and industry.

Let's connect

Spend zero hours on manual processes

Book a 30-min demo

Just imagine how that would transform your team’s productivity and focus? Talk to our financial experts to know more.

More posts