Meet Fuel MCP: talk to Claude about any financial decision


A recent EY-Parthenon analysis shows that only around 28% of the largest global companies stayed within 10% of their free cash flow guidance performance.
While this might not sound bad, that means that 2/3 of the companies who did do some financial forecasting didn’t do it well enough. Without accurate forecasting, you risk making misinformed decisions about investments, debt, and resource allocation, which can put your company at serious financial risk.
This article will help you avoid that mistake. We’ll start by looking into what balance sheet forecasting is and go on to show you how to make smart forecasts. We will also explain why you need them in the first place. Lastly, we will show how Fuelfinance can make your financial planning seamless, even if your startup is in the early seed stages with no revenue history.

A balance sheet forecast is one of the ways you can project your company's financial future. It considers what your company has (assets), what it owes to creditors and suppliers (liabilities), and also any commitments it has to shareholders (equity). A balance sheet forecast makes assumptions about the financial future of your business based on your current situation and financial history.
The result of an adequate balance sheet forecast is not just a rough estimate but a data-based assumption that will help your company meet obligations, minimize risk and secure financial stability and growth.
A balance sheet is a pivotal document for managing company finances. As we’ve mentioned, it shows what your company has, what it owes and its financial commitments to investors (assets, liabilities and equity).
Let's give you a detailed look into what these three areas cover:
Assets show what your company currently owns, whether cash, inventory, property or accounts receivable. Here’s what to pay attention to when doing balance sheet forecasting:
The not-so-sexy side of your sheets are the liabilities. They represent all company obligations, whether active ones towards suppliers, or debt and are a crucial part of your balance sheet forecast:
Equity, in a balance sheet, represents all interest left in the company's assets after deducting liabilities and obligations towards owners, shareholders or investors. Two categories stand out here:
Balance sheet forecasts help improve your company's financial health and project a realistic net working capital. Here are examples of how.
A balance sheet forecast helps you notice potential liquidity issues, anticipate challenges, assess debt and get an upfront view of your future repayment schedules. Plus, you can prepare several scenarios, from worst-case to best-case, taking into account interest rate changes, revenue fluctuations, potential investments and similar.
A well-put financial plan ensures your business keeps up with the daily circumstances and secures long-term goals and sustainable growth. An essential part of this is a balance sheet forecast.
With a solid forecast, you can plan ahead and anticipate investments, mitigate risks and maintain steady and healthy cash flow and liquidity. That will allow you to tackle any unpredictable circumstances along the way and seize growth opportunities.
We have already mentioned DSO (days sales outstanding) and DPO (days payable outstanding), CapEx, depreciation rates and inventory turnover and how they are essential to your forecasting. But you can expand this further, as a balance sheet forecast also impacts other metrics and KPIs.
For example, if you incorporate Monthly Recurring Revenue (MRR) or Annual Recurring Revenue (ARR) in your forecast, you take into account your most predictable income streams, which play a massive part in financial forecasting.
The same goes for Customer Lifetime Value (CLV) and average customer lifespan (ACL), allowing you to project how much you will earn from each customer and how long you will retain them, all based on your current numbers.
Because a balance sheet forecast outlines your future assets, liabilities and equity, it lets you notice trends, opportunities and challenges. You'll be able to estimate your liquidity for the future, giving you a heads-up about whether you’ll require additional financing or investments.
Creating several scenarios based on different factors lets you act confidently. If you plan for the worst – you’ll know what to do to stay above water if things go south.
When done right, balance sheet forecasting allows you to anticipate different scenarios, from worst-case to best-case. That way, you'll be able to make confident decisions and have a healthy degree of risk-taking while leaving enough buffer room if everything doesn't go your way.
For example, forecasting your balance sheet may unveil a potential liquidity problem due to the fact you have projected a slowdown in your accounts. Because this is a plausible business scenario, you'll be able to see if your company finances can handle such a situation.
Or you might predict that the interest rates will decline, meaning borrowing money will become cheaper. You can project that into your calculations and see how a loan refinancing may contribute to your overall financial state.
Now that we’ve covered the importance of balance sheet forecasting let's break down the steps you should take to make one.
Before creating your financial prediction, you need to select a tool to use.
You can use Excel. A model table is in our article below. While this is doable, the main problem with this approach is that you must make any adjustments manually for each calculation. Plus, one small mistake can ruin your projections, and you need access to your PC to correct them. You will also have problems synchronizing those changes with the rest of your workflow and other apps you use.
If you want a more intuitive solution to help you run your finances from a single dashboard, consider comprehensive finance analytics software.
Fuelfinance is an all-in-one finance solution that helps businesses keep their finance in check and make data-driven decisions for steady and wise growth. Because it gives you three financial statements—P&L, cash flow, and balance sheet—you can make predictions based on the most important financial information.
Everything is pulled from your Quickbooks account and available on any device. As the software is cloud-based, you don't have to worry about manual updates or mistypes affecting your calculations.
Fuelfinance can help you with balance sheet forecasting as it shows projections automatically alongside current numbers, allowing you to see where you are now and how far that is from your projected goals.
Interested? Book a free demo to see its capabilities for yourself.
Consider previous balance sheets, as they provide valuable insights into recurring trends. Fuelfinance can help you with this as it fully integrates with Quickbooks, allowing you to pull historical data in a few clicks.
Start from your most recent balance sheet and roll forward the data, as it will be a reasonable basis for your forecast. Of course, not every item there will apply to the future in the same way. This is especially true for entries such as the accounts payable. But you can always start from net zero and then calculate them as a percentage of other accounts.
Once you have your data, look for trends and patterns. Notice how assets, liabilities and equity change over time. That will help you determine if similar circumstances may drive that type of change in the future.
Also, pay attention to seasonal shifts— any recurring trends or unusual spikes should be considered when forecasting. This type of information is essential when creating several scenarios, which you can do right from the Fuelfinance dashboard.
On the other hand, if you are just starting and have no historical data, no worries—you can still create scenarios based on informed assumptions and industrial trends.
You should think through your business plan and see if and when you expect investments, how many clients you expect per each upcoming period and what type of expenses you expect. This will allow you to make data-driven predictions and assess your company's future financial position.
The key drivers for the success of each effect depend on your business model and carry the most significant reward potential and the most considerable risk.
For example, when it comes to inventory, key factors to consider are historical trends, supplier lead times and demand forecasts. Regarding debt, interest rates, repayment obligations and repayment schedules are crucial.
That's why using financial modeling software while focusing on key drivers allows you to create realistic scenarios and benchmarks to keep an eye on. For example, you can make inventory turnover targets based on your history, bypassing any bottlenecks, such as overstocking seasonal items.
A cash flow forecast and income statement greatly influence your entire prediction. That's because they dictate the liquidity of your business, which plays a pivotal role in ensuring a steady financial future.
Plus, operating expenses affect payables, while revenue forecasts drive receivables, so it's integral to pay close attention when forecasting income statements.
To help, we have created this cash flow planning cheat sheet, which you can download completely free.
To help you visualize the concepts we mentioned in the article, we came up with this model balance sheet forecast. It predicts three future business years in three classes (assets, liabilities, and equity) and starts from the data from the current year.
While Excel tables are useful, you do have to update them manually. Advanced small business financial planning software such as Fuelfinance gives you a much more comprehensive view of your present and future finances and uses real-time data pulled directly from your Quickbooks account, which allows you to notice trends and make changes immediately.

Fuelfinance is an all-in-one finance analytics software that helps businesses keep their finance in check and make data-driven decisions for steady and wise growth.
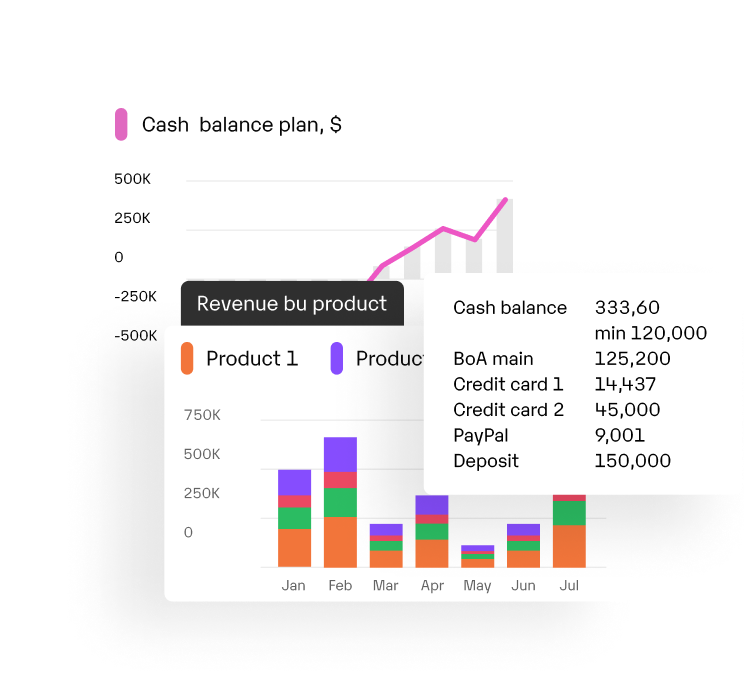
Fuelfinance presents your current financial state and shows you what kind of growth you can expect, making it an excellent financial forecasting tool for startups. Our tool always shows you two predictions, represented in a single graph, next to your current data. That way, you know exactly where you stand at any given time, compared to best-case and worst-case scenarios/ All the data is synced in real-time from your Quickbooks.
But Fuelfinance doesn’t stop at forecasting—you’ll see all your most important KPIs at a glance, depending on your business model. Everything is presented in an all-in-one dashboard that makes your financial data easy to understand.
Furthermore, Fuelfinance combines automation with expert support—you will have a dedicated financial manager at your disposal. That means you’ll always have someone to address if you are unsure about the forecasting process or any other financial issue.
Sign up for a free demo to see how it works.
If you’re just starting out and don't need an entire dashboard of financial analytics but just a tool to help you get off the ground, check out the Fuelfinance Bootstrap plan, which is ideal for early-stage startups. Here’s what it includes:
Because we realize how daunting finances can be while you try to grow your business from scratch, we also created a free financial content library for startups. There, you will find all the resources needed to understand what you need to do in terms of your startup's financial security.
Balance sheet forecasting is a valuable financial management tool. In the process, you collect the financial history of your assets, liabilities and equity and make assumptions about how the future of these critical financial items will look. A balance sheet forecast helps you ensure financial stability by managing risks and helping you plan for healthy and sustainable growth.
Fuelfinance is there to help businesses like yours grow by providing an easy-to-understand yet powerful dashboard that contains everything you need to know about your startup's finances, with expert help from our financial experts ready at any time. But, it doesn't only focus on the present moment—it gives you estimates that allow you to make data-driven predictions.
Book a free Fuelfinance demo now, and never worry about your startup's financial future again!
To create a balance sheet projection, you should first look at your current balance sheet, as it will be the foundation of your forecast. Then, you should choose a tool you will use for the calculations.
Excel can work, and we even have a model table in the article, but the problem is that it requires manual updating whenever something changes. And if you are using offline Excel, you can only access it from your computer.
Advanced business budgeting software such as Fuelfinance works in the cloud and automatically gathers data from Quickbooks, meaning everything is updated in real time. Plus, you will always have two forecasts—High Growth and Baseline. That lets you see how your business compares to best-case and worst-case scenarios at any given time.
To calculate a projected balance sheet, you first start by gathering historical data from your previous balance sheet. Then, you identify key drivers and start forecasting each—assets, liabilities and equity. Lastly, validate the results to ensure everything is in line (for example, assets should include total liabilities and equity), have the cash flow calculation to support your projections, and if that aligns with trends from the previous balance sheets.
You can use Excel to create a balance sheet projection. You can find many templates online, and our article also contains a model table you can use to get started.
First, gather historical data from your previous balance sheets to make a projected balance sheet. Input assets, liabilities and equity to determine the base financial position on your balance sheet. Then, input the key drivers and appropriate formulas that show their relations (for example, you can calculate fixed assets by subtracting depreciation from previous fixed assets and adding CapEx to the equation).
While Excel works OK, using a modern tool such as Fuelfinance simplifies balance sheet forecasting and makes your company's finances far less complicated. Fuelfinance automatically draws data from your Quickbooks account, meaning you always have the latest data. That means you won't have to update your tables by hand, wasting time and risking manual errors.
Accounts payable (AP) shows how much you owe to suppliers. A simple formula to calculate it is to multiply COGS (cost of goods sold) with daily DPO (days payable outstanding), all based on your historical data of previous financial statements:
Accounts Payable = COGS × (DPO/365)


Just imagine how that would transform your team’s productivity and focus? Talk to our financial experts to know more.