Meet Fuel MCP: talk to Claude about any financial decision


Do you get a throbbing headache whenever you think about how to do a financial analysis? We get that — there are a lot of business metrics that need tracking and examining, which seems even more overwhelming if you don't know what you're doing.
Think of your small business financial management the way you would of a fitness journey. Stick with us. How frustrating would weight loss be without tracking calories? Writing down all your meals seems inconvenient before you get used to it, but it's the best way to see if you're on track. To reach your goals, you need to see how much energy you're taking in and how much you're spending. With this approach, you'll lose pounds in no time, probably even with an extra chocolate bar here and there.
Do you see the analogy? It's damn near impossible to run a profitable agency without keeping an eye on your KPIs. Whether you're tracking marketing agency metrics or financial performance indicators, agency owners need clear visibility into their agency's financial health to drive agency success.
Stick around to the end for an agency metrics cheat sheet and tips on becoming (and staying) a profitable business with the help of awesome FP&A software.
First, we'll go over 31 agency metrics & KPIs and provide formulas for calculating them, where applicable. As the saying goes, "You can't improve something you don't measure." These metrics will help you gain valuable insights into your entire agency's performance and support more informed decision-making.
Your total revenue is the total amount of money from the billed goods or services. This is "sales" at the top of your income statement. The revenue generated from client projects is the lifeblood of your entire business.
Note that revenue is not cash — in accrual accounting, revenue is recognized when the sale is made, regardless of when you receive the actual payment (cash). Revenue also shouldn't be confused with profit. Profit is what is left when you subtract all the expenses from the total revenue, including COGS, operating expenses, taxes etc.

This is the money you currently have for the work you have yet to deliver to your client. It's also called unearned revenue, so basically prepayments received.
This is — you guessed it — the average monthly revenue or the revenue you anticipate receiving monthly. You can predict these earnings based on your current number of subscribers, long-term contracts, refills of supplementary goods or historical data on your top-selling products.
MRR is one of the key unit economics metrics primarily used for subscription-based businesses. It provides valuable information for investors and fuel for financial planning software to create your future spending model.

This is your monthly recurring revenue times 12 (the number of months in a year). You may not have recurring revenue yet, but you should definitely work toward it, as it makes your finances more stable and predictable. For most agencies, building recurring revenue is essential for long-term business growth.

ABR is short for the average billable rate, a.k.a. the average amount of money earned for each hour of billable work performed by your team.
This metric is especially relevant in a company like a marketing agency, where consultants can be temporarily hired by other organizations to work on, e.g., marketing strategies and marketing campaigns.

Let's say your marketing team spends a total of 100 billable hours working on client projects and generates $10,000 in revenue from those hours. The average billable rate would be $100 per hour ($10,000 total revenue / 100 billable hours).
ACPH is the average cost of an hour of your team members' time. Essentially, this shows you how much your employees cost you. Understanding the actual project time and actual project cost helps agency owners optimize profitability.

The churn rate is the total number of customers or revenue lost over a specific period. You can count this in cancellations, downgrades etc. Monitoring churn is critical for understanding client retention across your own business.
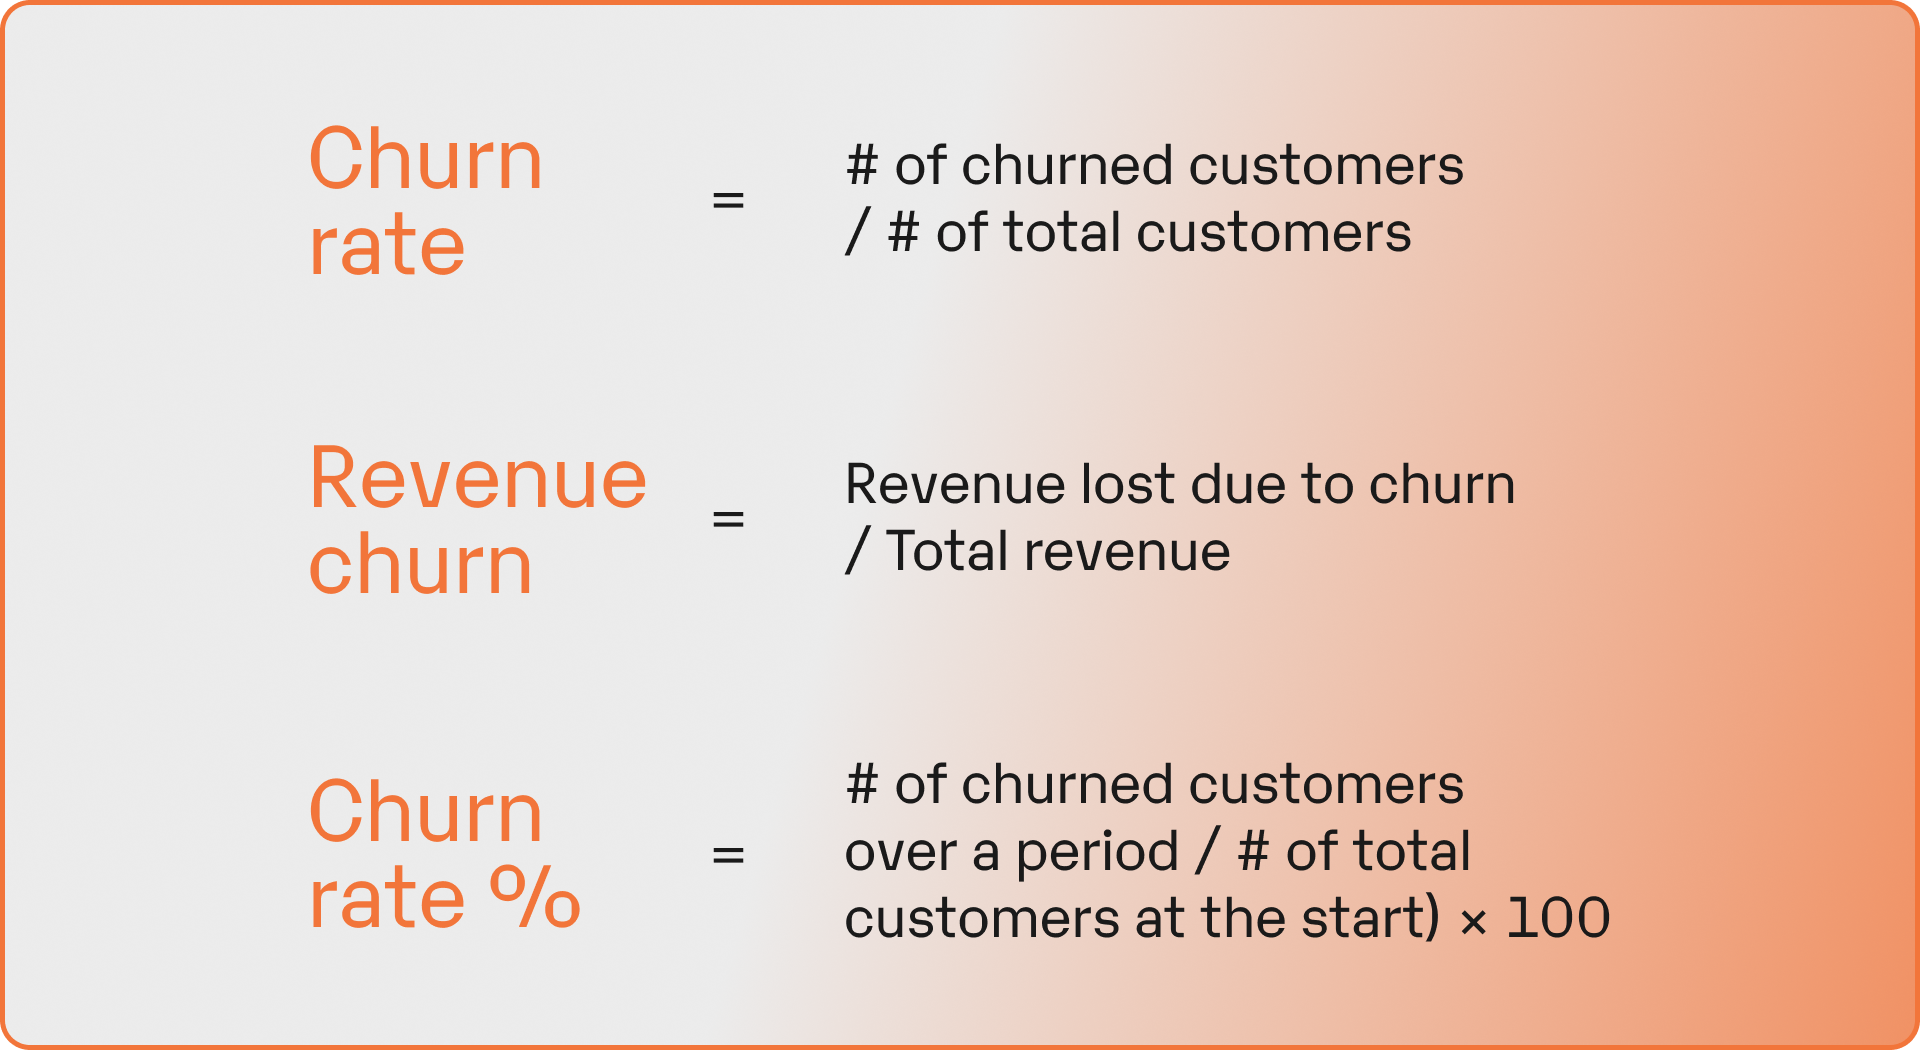
The "negative" part might be misleading (hint — it has positive consequences). This happens when revenue growth from new clients (including upgrades, service options, add-ons etc.) surpasses the lost revenue from your churn rate (which you just calculated in the previous step). Meaning — even though you have churn, your revenue still grows.
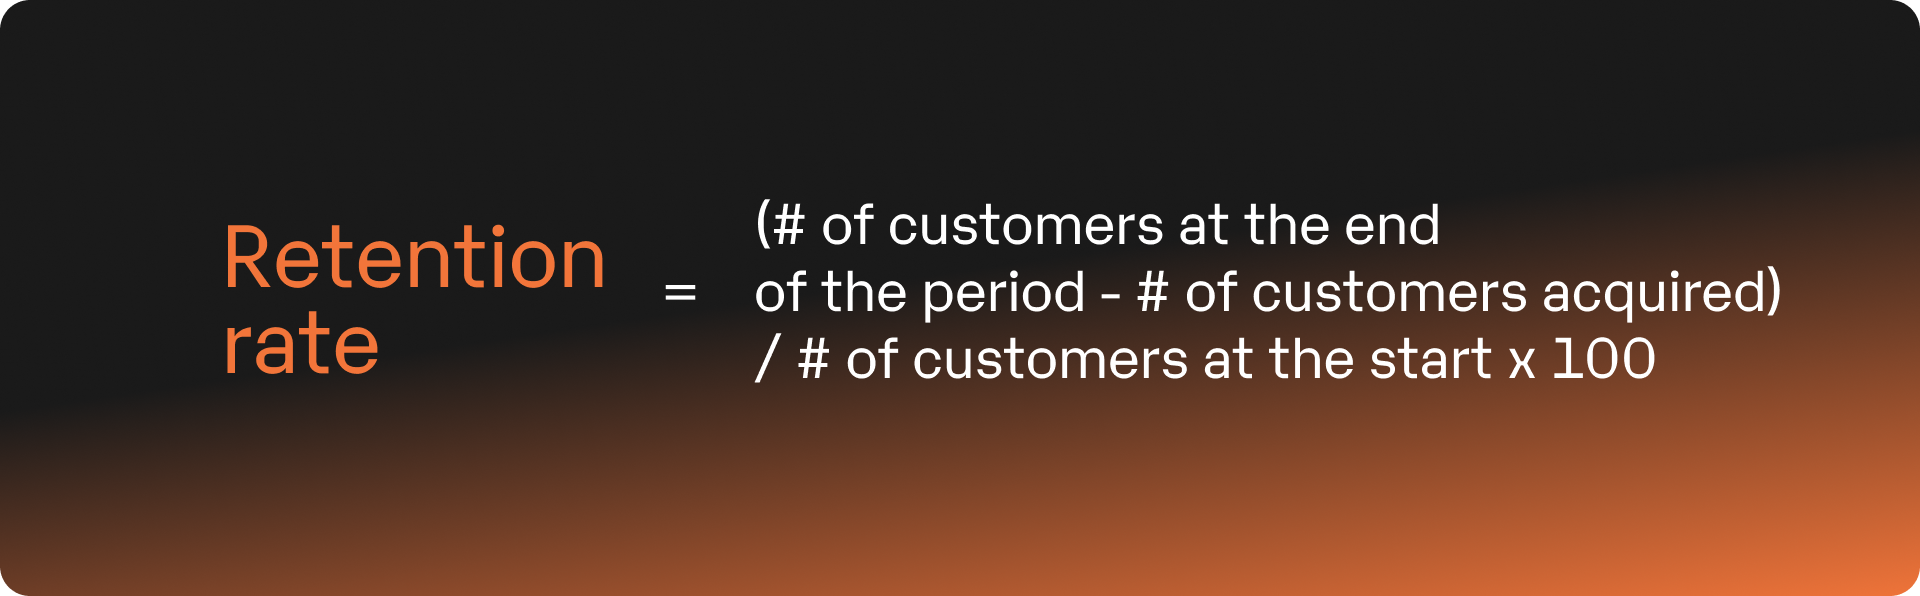
This is the percentage of all clients who continue paying for your product or service in a specific timeframe. The client retention rate is one of the most important marketing agency KPIs for predicting sustainable growth and customer success.
ARPU, one of the key SaaS metrics, is self-explanatory — the average money you make per every paying customer.

Does this metric seem similar to the previous one? Rightly so, but it's not identical. A user can have more than one account, so the average revenue per account is likely smaller than the revenue per user, but the number of accounts is greater.

A customer's lifetime (LT) is the total time someone stays with your company, i.e., the duration of a company-client relationship from when they start paying for your services to the day they stop.
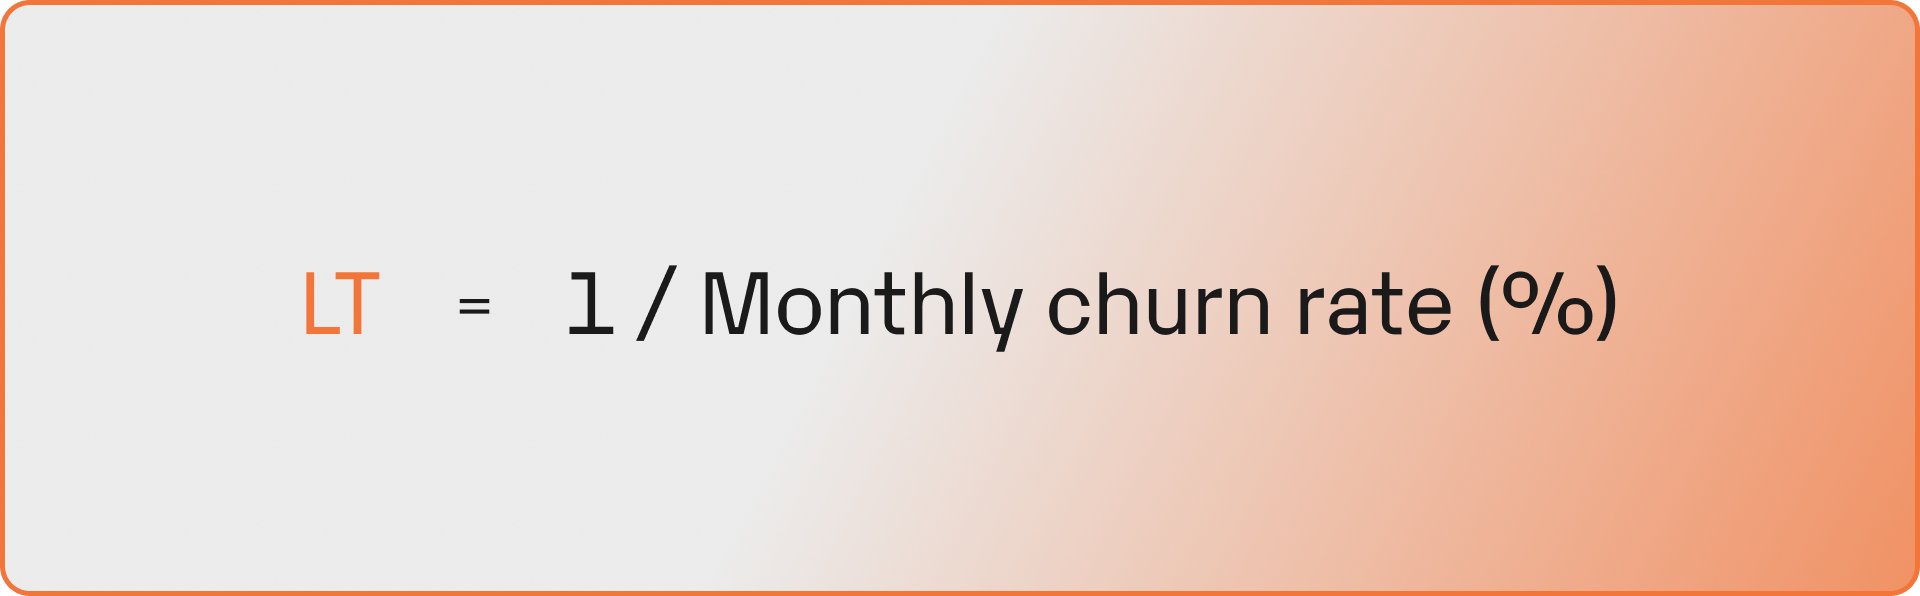
You can also calculate the customer lifetime value (CLV or LTV) based on LT. This is a prediction of the revenue a customer would generate throughout their relationship with your company.

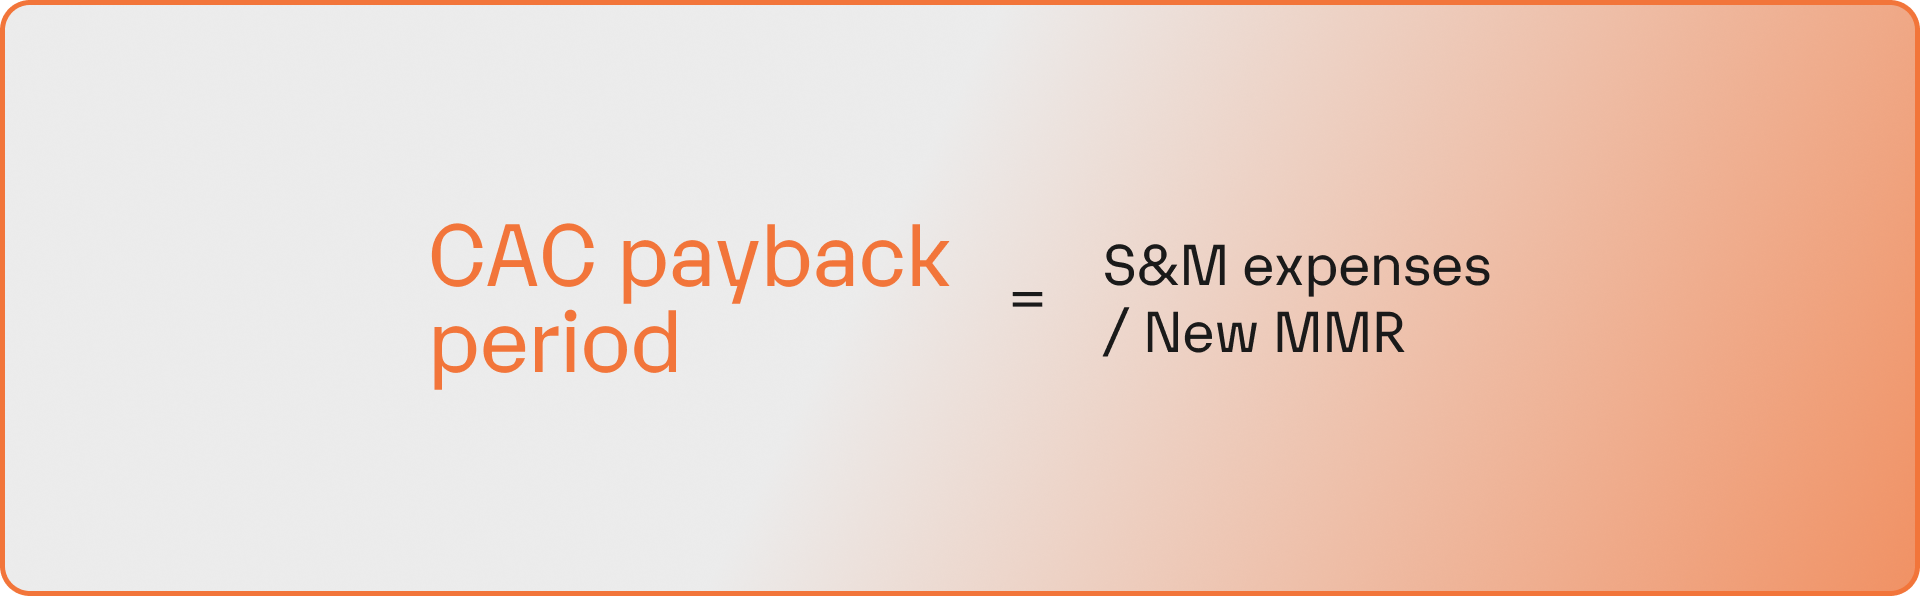
This is the total cost of getting new clients — which, as you probably figured out by now, is a whole lotta work. The client acquisition cost includes stuff like the cost of running marketing campaigns, software expenses, payroll, ad spend, marketing budget allocations, and sales initiatives. Both your sales team and marketing efforts contribute to this metric.

Here's a little bonus — a formula for calculating customer acquisition costs (CAC) payback time:
Accrued expenses are costs incurred in one accounting period but not yet paid.
This covers all contractor and employment costs and salaries necessary for your company to maintain and manage the business and ultimately generate revenue. This includes your sales team, marketing team, and other essential personnel across your entire agency.
These are all the additional (non-salary) expenses necessary for your business development and smooth operation. This includes Sales and Marketing (S&M), Administration and Facilities spending.
Free cash flow is all the money you have left after you pay all your operating and capital expenses.
This covers all direct expenses that you pay for immediately, like sub-contractor fees, utilities, software licenses or supply costs.
This (admittedly not particularly catchy) abbreviation represents the measure of your operating performance. It's your profitability measure, but not your net profit.
The cost of sold goods covers all the expenses necessary to provide your service or make your product, like direct labor, tools etc.
This is all the money you have left after subtracting the costs of sold goods and services, advertising, selling and logistics.
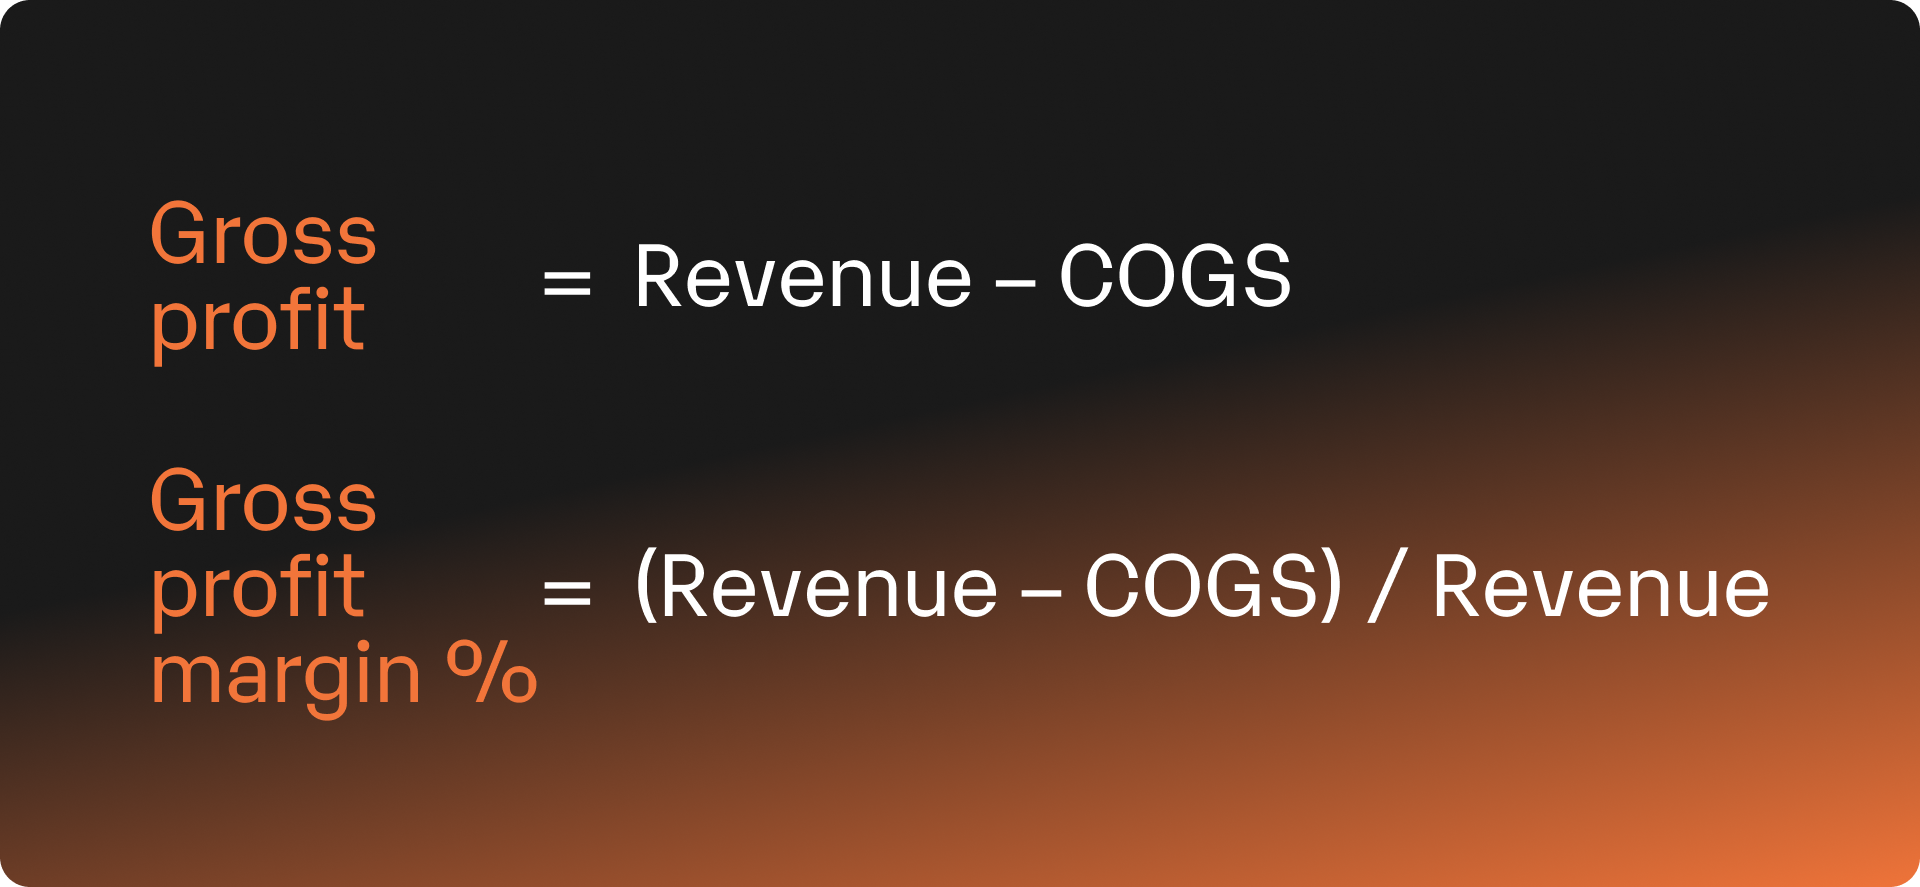
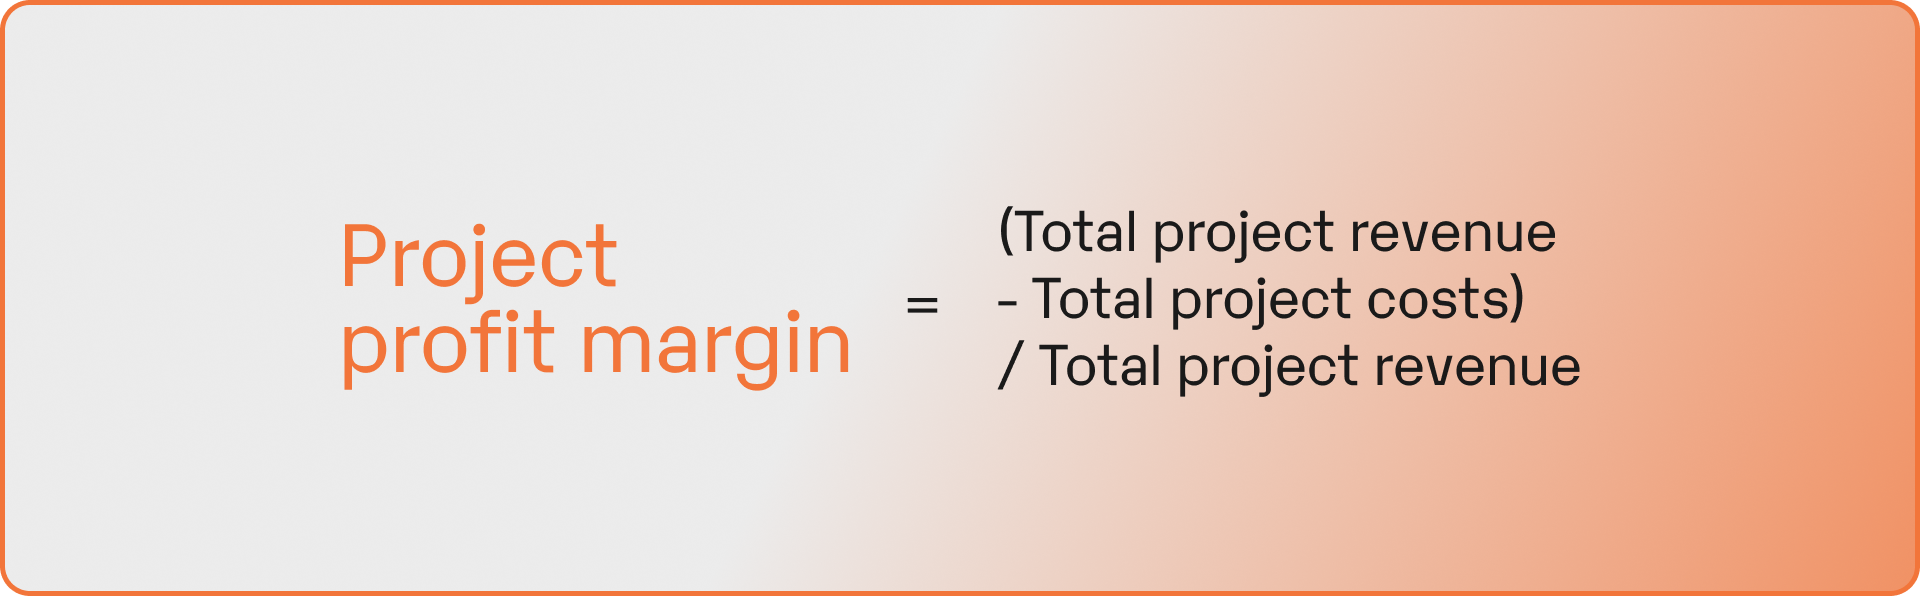
Profit margin is the percentage of your revenue that you keep as actual profit after calculating the costs of sold goods or services. This is a critical metric for assessing your agency's financial health.
Total capacity means the entire time of all your team members, including the time spent at work, not necessarily on clients.
The utilization rate is the time your employees spend specifically on client work. Tracking actual project time against total capacity helps identify inefficiencies in your sales process and delivery.

This is your revenue after subtracting all expenses and taxes. Net income after taxes (NIAT) is at the bottom of your income statement. Hence, some call it the bottom line (as opposed to revenue, which is the top line).
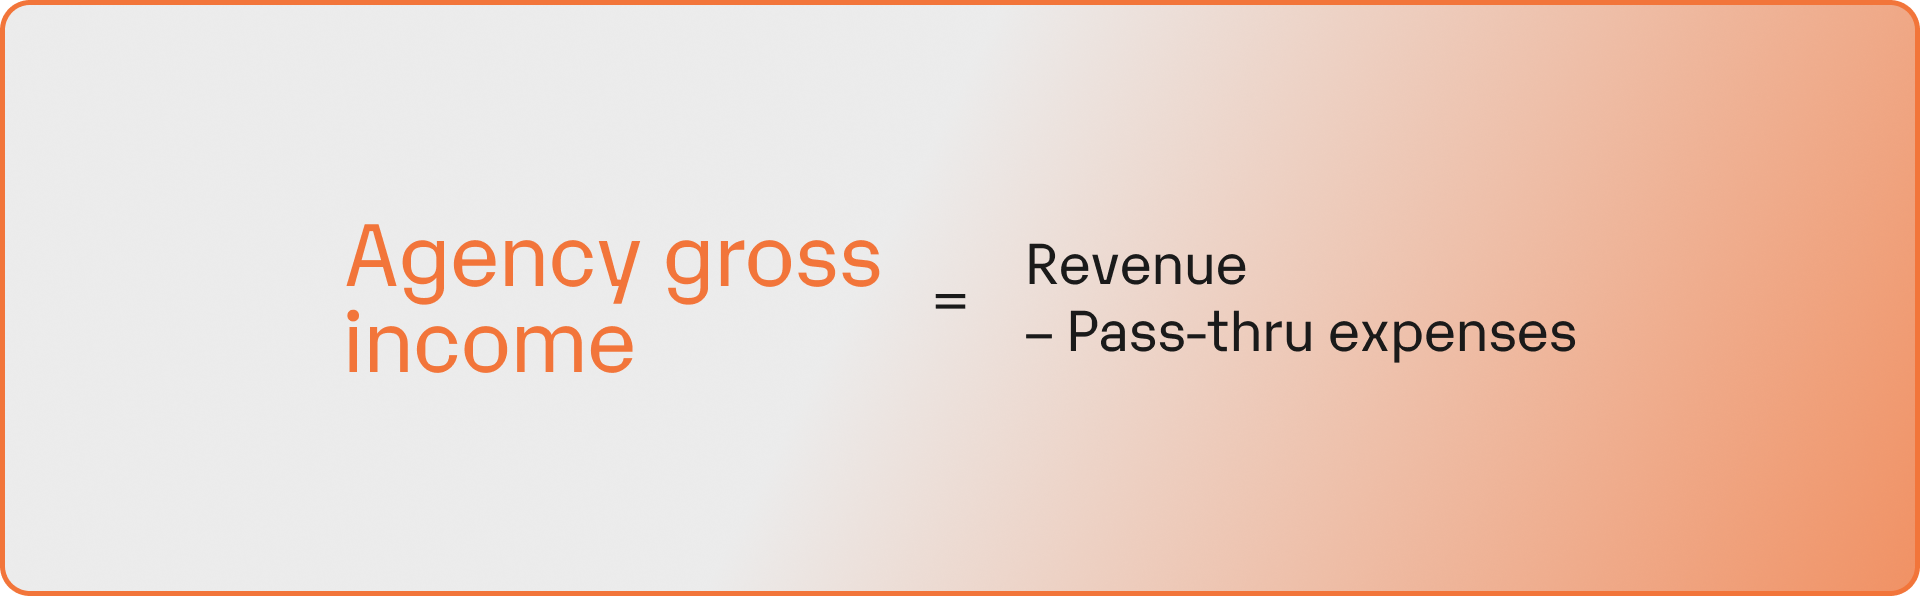
Agency gross income is the revenue left after subtracting only the pass-through expenses.
Cash balance is the simplest of all your metrics — you don't need fancy formulas to calculate it, just a look at your bank account. It's simply the total amount of money your company has at any given time.
You need to maintain a healthy cash flow to ensure a positive cash balance and be able to fund all your planned operations. At their core, all the metrics from this article are necessary for this simple purpose — not running out of cash. Well, that and making you a more profitable business.
This is all the cash (or cash equivalents) your company receives from sales plus investments or financing. Note that revenue and cash inflow may differ, e.g., when offering goods or services on credit, revenue is recognized even though you haven't received cash.
As you've probably worked out on your own, this is the opposite of the previous point, so the actual, total cash flowing out of your organization over a specific time. It can cover anything from operational costs to liabilities and debt payments, including marketing budget expenses and sales efforts.
The cash burn rate is the rate at which a company uses its cash over a specific period. You can calculate a gross or net burn rate. The gross burn rate only considers your cash outflows for a particular period, while the net burn rate also considers the cash inflows (cash sales generated) in the same period.

The conversion rate is a percentage that shows the number of people who interact with your company and complete a desired action. This activity can be signing up for your email list, filling out a lead generation form or purchasing your product or service. Understanding conversion rates at each stage of your sales funnel helps optimize your marketing strategy and sales process. Tracking marketing-qualified leads and their conversion to customers provides essential marketing metrics for evaluating the effectiveness of your marketing campaign efforts.

Now that these terms sound less foreign, you can start using metrics to your advantage. Here are some helpful tips you should follow to improve agency profitability and drive business growth for your own business.
Fun fact — customer satisfaction will improve in this process, as you focus on boosting operational efficiency. Strong client retention naturally follows when you deliver better results through data-driven operations.
We recommend setting up realistic targets for all metrics, particularly the following:
Here are some benchmarks to help you visualize what numbers to aim for when drafting your financial model. These benchmarks reflect what most agencies achieve at various growth stages.

Increase your average billable rate by raising pricing for your product or service and decreasing working hours.
The first method is simple enough, although you should keep it affordable for your target customer and ensure you provide adequate value for the price.
For the second way to increase your billable rate, here are some things to consider:
We recommend a tool like Xero or QuickBooks for automated accounting. They have different features, but both help you save time and money. Alternatively, you can check out our comparison of the best QuickBooks alternatives.
This means getting less expensive people to do a larger share of the work within your company and, again, focusing on automation where possible. Consider employee training to help hires do their job smoothly, or implement monitoring to limit time-wasting.
The utilization rate we recommend aiming for is 65%. If you're far from that number, start by making an accurate plan for new revenue and projects. Then, connect it to your workforce capacity and hiring planning.
Here are some tips on improving utilization:
We wanted to make things easier for you, so we created a cheat sheet with all the metrics we discussed, including formulas, benchmarks and optimal tracking frequencies.
Don't be shy — get the free cheat sheet.
You can also check out this free agency health assessment calculator.
It evaluates your business across the metrics that matter most in your industry. There are only 10 one-click questions you’ll fly through, and all of them are crucial to understanding if you're on the right track.
You’ll immediately get personalized, actionable recommendations on how to improve your agency’s financial health.
Need even more help? We've got you.
Circling back to our fitness analogy — think of a calorie tracker, but for your company's finances. Yet, Fuelfinance does much more than just track your agency metrics. It acts as your AI-powered financial command center combined with expert outsourced CFO support.
Here's what you get:
Key advantages for agencies:
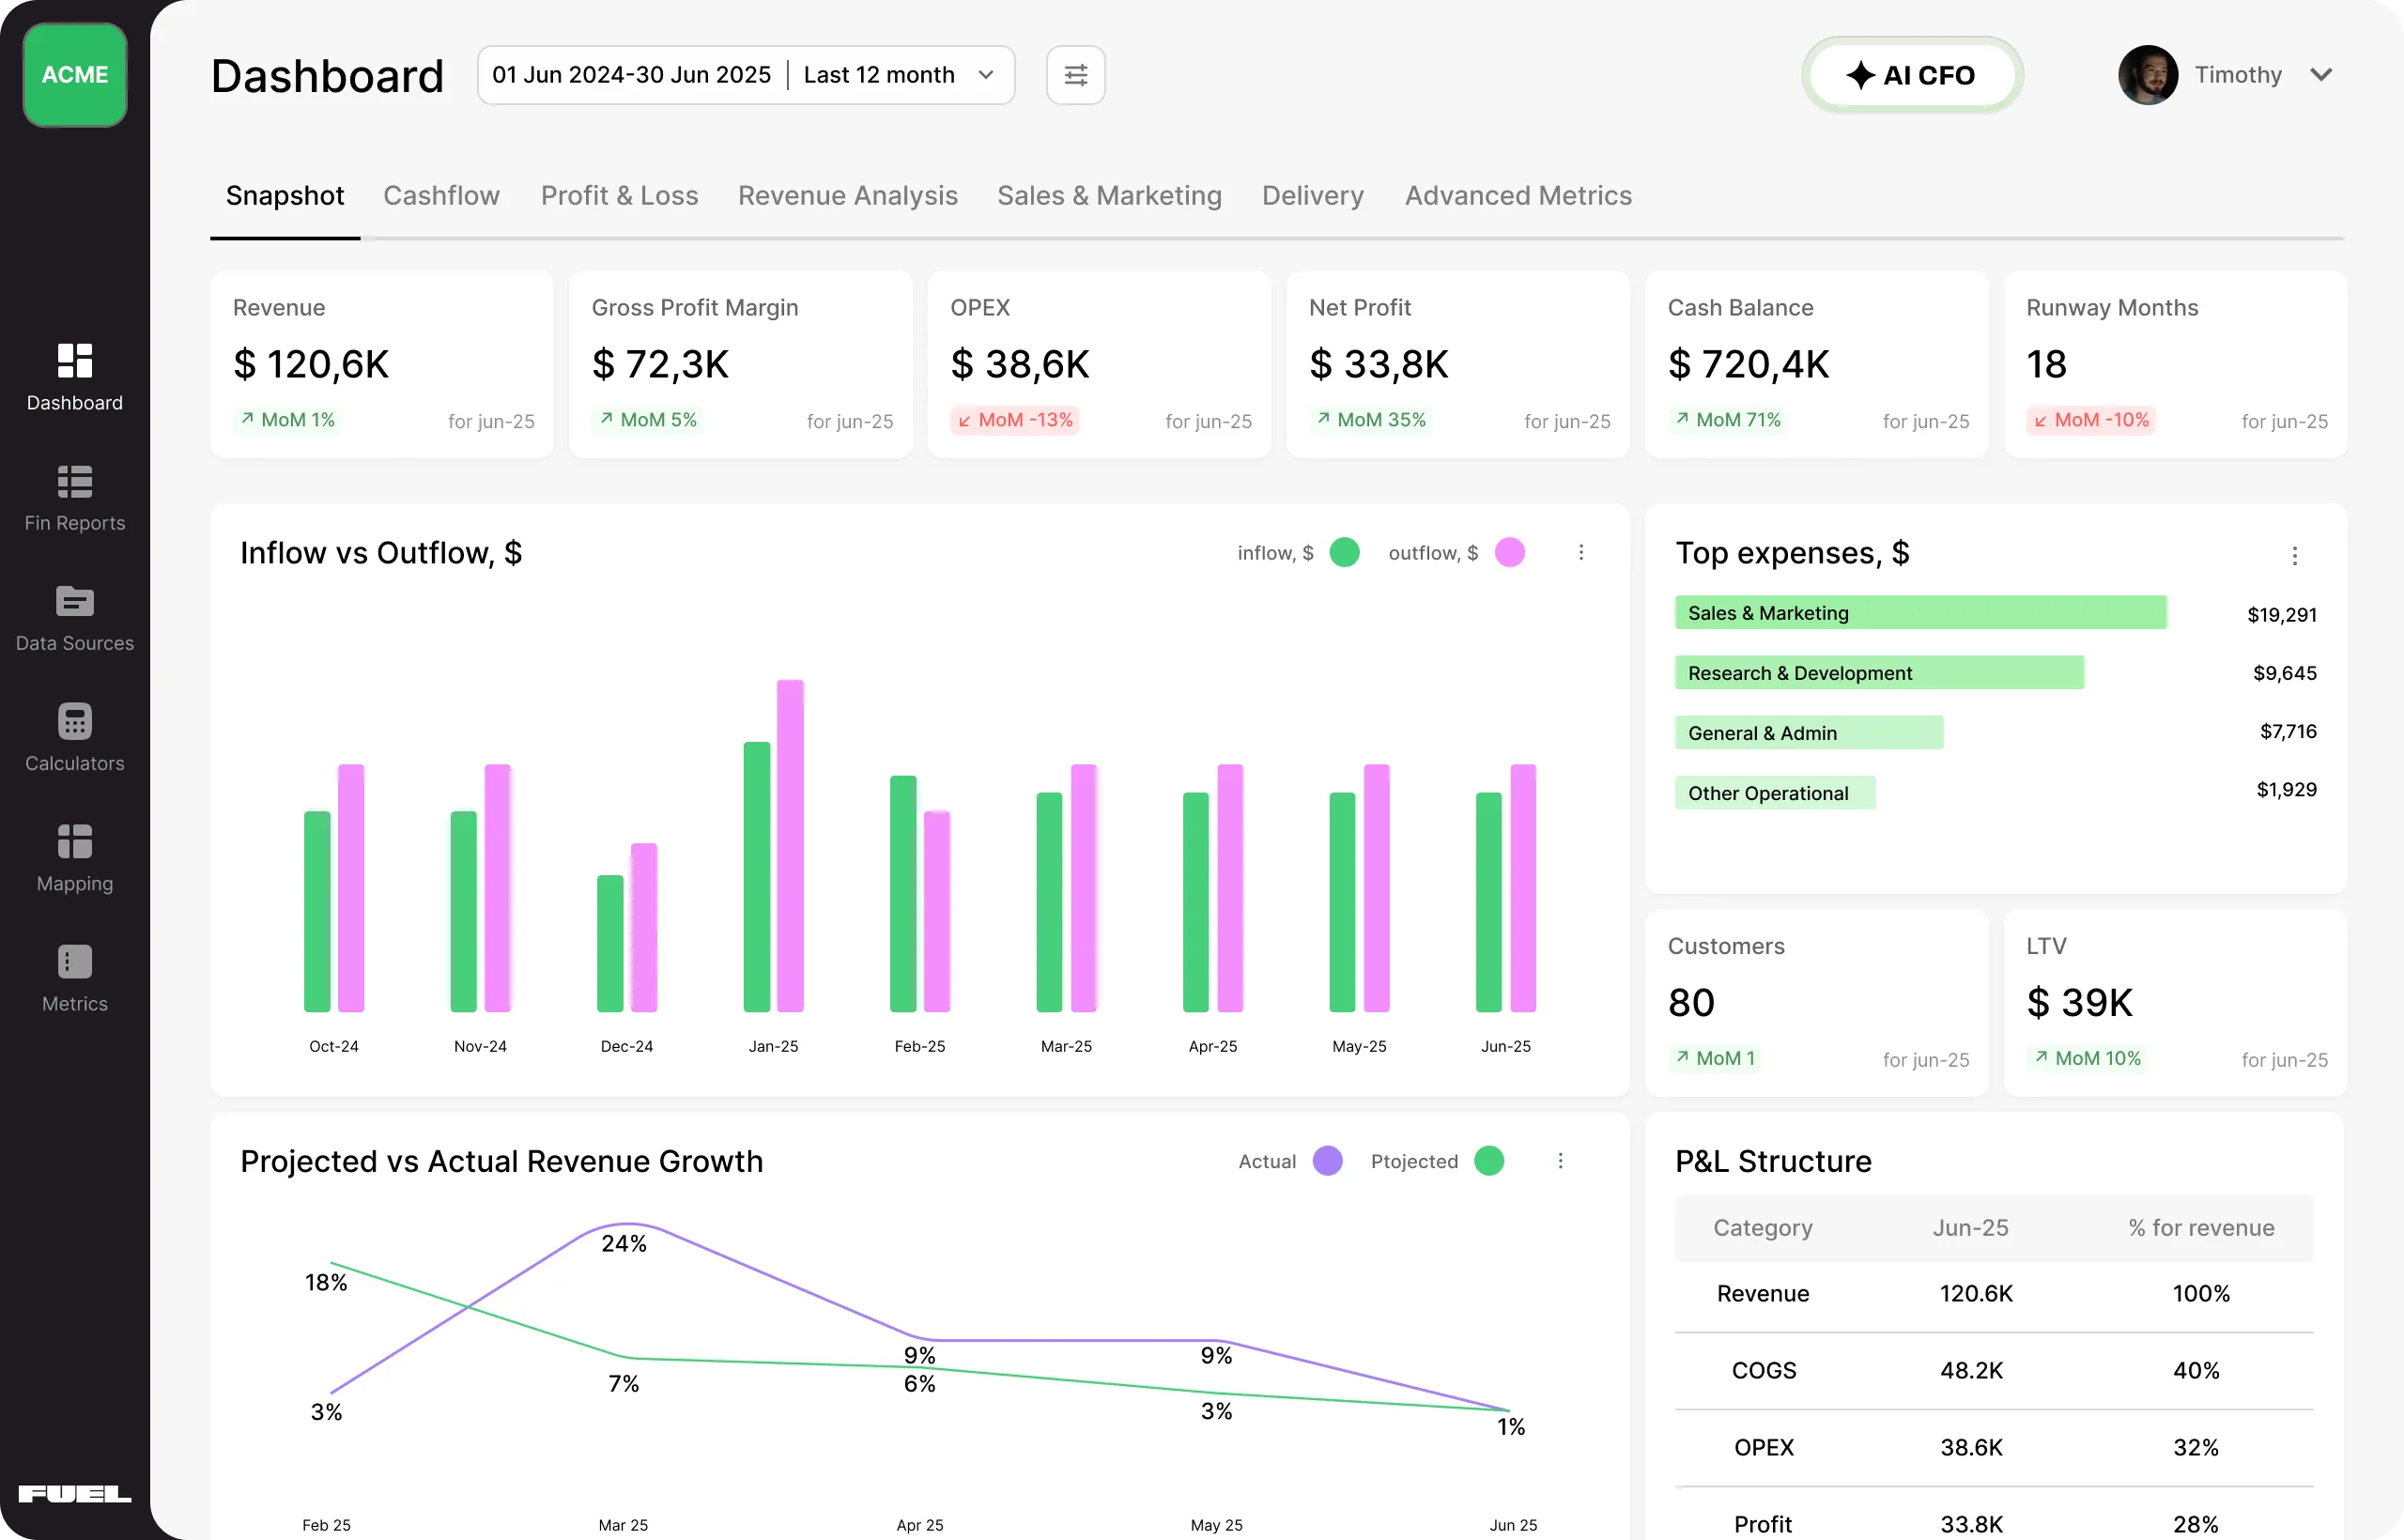
With our comprehensive financial management solution, you get an extensive CFO-level dashboard with all the key performance indicators and marketing metrics, as well as personalized suggestions about what to track based on your business model, plus how to fix irregularities and bottlenecks. Spend just one hour weekly monitoring your key metrics. Use all that extra time you've saved to focus on client retention, sales efforts and strategic initiatives that drive agency success.
This combination of proprietary software and financial experts is both powerful and easy to use, making it the perfect leg-up for agencies and businesses that want to focus on fast growth instead of worrying about running out of cash.
31 might sound like a hell of a lot of metrics to track, but we believe these are the necessary basics. Understanding and tracking this data will make you feel like you're finally in control of your company.
Trust us when we say — Fuelfinance makes it easier done than said. Or don't — and test it out on your own. It pulls data straight from your accounting software and makes financial forecasting for agencies and other professional services a breeze. Our Bootstrap plan is free to test and includes step-by-step tutorials on tracking key agency metrics. You can also book a short demo call here to see firsthand how Fuelfinance can support your growth.
Agency KPIs or metrics are quantifiable measurements for assessing an organization's performance. Some are specific to industries or departments, while others are universal for all companies. There are plenty more we didn't cover in this article, including client satisfaction, employee satisfaction, lead generation rate, sales qualified leads, sales closing ratio and customer or employee net promoter score.
The blueprint for measuring performance is the same for digital marketing agencies and every other business type:
Fuelfinance is one of the best financial analysis software options, making performance improvement easier with clear dashboards that give you visual insight into all your financial data and future forecasts.
Profitability metrics are all the measurements connected with your effectiveness in generating profits. Those include gross profit margin, net profit, cash flow and other indicators that help you understand your agency's financial health and overall agency success.
Agency metrics focus heavily on time-based profitability since agencies sell their team's time rather than physical products. While all businesses track revenue and profit margins, agencies need specific metrics that regular businesses don't, like:


Just imagine how that would transform your team’s productivity and focus? Talk to our financial experts to know more.