Meet Fuel MCP: talk to Claude about any financial decision


How do you know whether your SaaS business is on the right track?
There's no other way around it but to measure the key SaaS metrics and see how you compare to other similarly-sized SaaS companies.
We've included the top 15 KPIs you should track to give you a truthful picture of your profitability and chances of success. By the end of this article, you'll have a clear understanding of what they are, how to calculate them, and what tool can make the whole process easier; spoiler alert – it's financial modeling software.
We have divided key SaaS metrics into two groups:
Ready to dive in? Let’s begin with financial metrics.
SaaS financial metrics measure the profitability of software-as-a-service companies. You could argue they're the most important SaaS metrics hence, we put them at the top of our list. They're the base of financial forecasting for startups and making wise decisions regarding pricing models, sales process optimization and cost management tactics.
Not all traditional metrics translate well into this industry because the SaaS financial model is all about digital products and subscription payments, as opposed to selling physical products or one-time payment services. Here's a list of important metrics that are SaaS-specific.
The monthly revenue you anticipate receiving is based on your current number of paying customers and long-term subscribers. It's one of the most important SaaS metrics, as it gives you and your investors an insight into your business’ profitability and scalability.

Analogically to monthly recurring revenue, ARR is the estimated revenue you receive from all your yearly subscriptions. Recurring revenue is super valuable because it makes small business financial planning easier.

Metric 3: Customer lifetime value (LTV)
Let's break this term down a little bit. The first part, i.e., the LT, is a customer's lifetime. It doesn't concern their actual lifespan, of course, but rather the time they remain your paying customer. You measure it from the day they sign up for your services to the day they opt out. The result is an average lifetime for all your customers.

*Scroll down to see the churn rate formula.
Based on this number, you can go on to calculate the customer lifetime value (CLV or LTV). This is a valuable prediction because it gives you an idea of the revenue generated by the average customer throughout their relationship with your SaaS business.

ARPU, or average revenue per user, is the mean money you make per each of your paying customers. You can calculate it by simply dividing your MRR by the number of your subscribers.
This metric is as simple as it sounds – the cost of getting a new customer. The total includes how much you spend on marketing campaigns, lead generation, software expenses, sales outreach, payroll, etc.

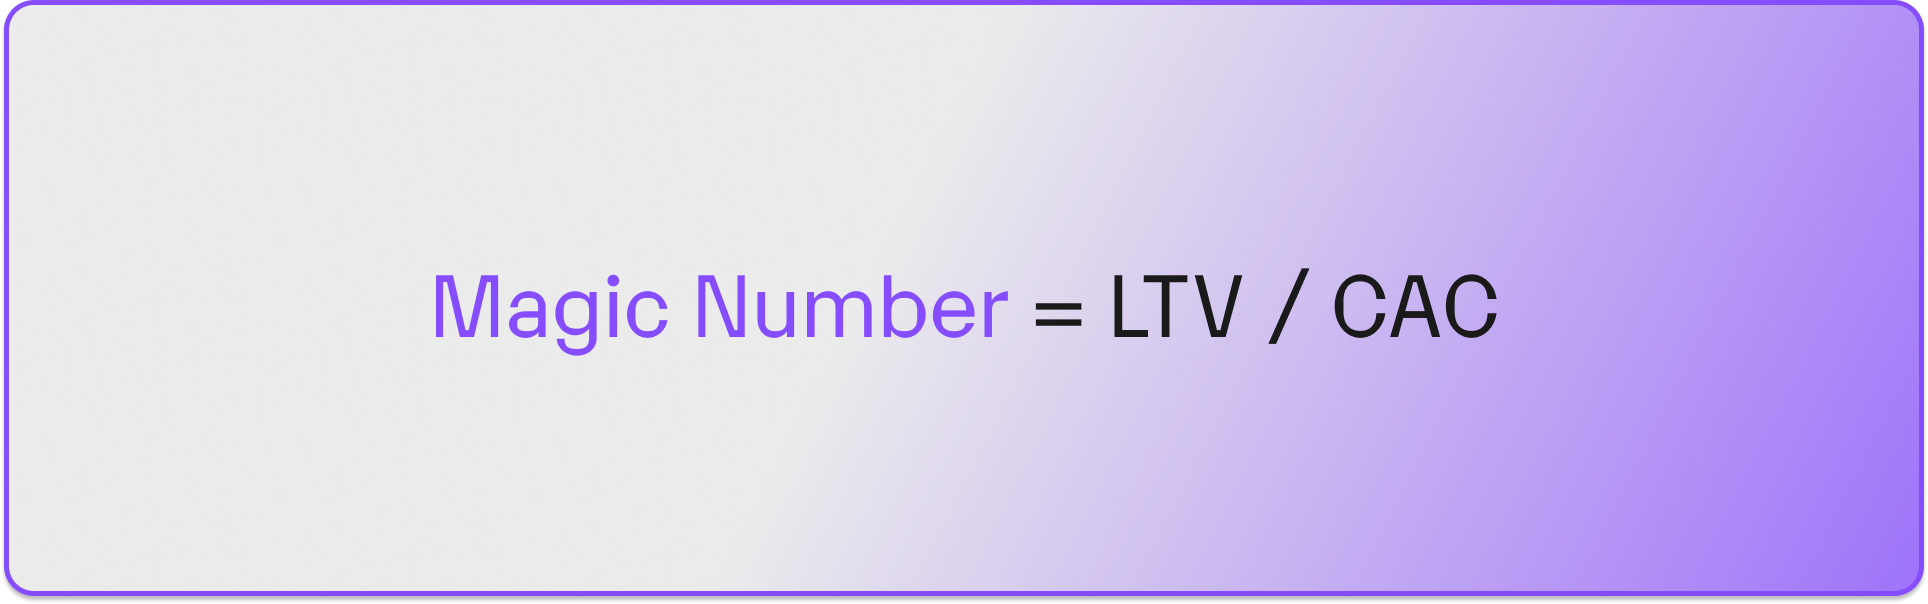
This ratio is also sometimes called the "magic number". You get it by dividing the customer lifetime value by your customer acquisition costs. This info shows how many times the total revenue from one client covers the cost of acquiring them.
The goal is to get it to at least 3:1, which means that the average revenue per customer is three times greater than the cost of acquiring that customer. If it's less than 3:1, you need to work on reducing the cost and time it takes you to acquire customers.
Expansion revenue is the additional revenue your existing customers bring you through upselling, cross-selling, increased usage or renewals with price increases. You can calculate this on a monthly or yearly basis.
When you have enough upgrades and cross-sells, you can even push your churn rate into the negative, meaning your expanded revenue is larger than churned revenue. A high expansion revenue indicates that you're giving your customers value while increasing their trust in your company and dependency on your products.

Net revenue retention, also called the net retention rate, is the percentage of revenue a business retains from existing customers over a certain time frame. You're aiming for a result of above 100%.

ARPA is how much revenue a single account generates. Note that one customer can have a couple of accounts, so it's not the same as the ARPU (average revenue per user), which we described in the LTV section.
Tracking ARPA over time and applying segmentation to the collected data can help you find valuable trends in customer behavior and make more accurate growth forecasts.

Note that the timeframe for this equation should correspond with your subscription model. You may have to switch the recurring revenue to an annual or quarterly format.
The customer acquisition cost (CAC) payback time can also be called months to recover CAC. Whichever term you stumble across, it's the same thing – how long it takes to regain the money spent on getting a new customer. The shorter this time is, the bigger your potential for growing a profitable business model.

Our next group of metrics is all about how your clients feel about your company – whether they're satisfied with your services and want to continue using them.
Acquisition metrics relate to how effectively you get new clients. Engagement is all about how your existing customers interact with your product. Retention tells you how happy your clients are with your solution and whether they feel inclined to keep using it.
Focusing on these KPIs is vital for effective small business financial management because you can't make money if your customers don't want to use your product.
The customer engagement score is a simplified summary of things like – how often someone logs in or when and how they're using your product. This indirectly illustrates the potential for customer churn spikes. If you're giving clients enough value that they've made your solution a part of their lives, they're unlikely to cancel. In such a case, you can pat yourself on the back and know you're on the right path for growing MRR.
To get your CES, choose engagement metrics most relevant to your company. Here are some examples for inspiration:
Next, assign weights of importance to each metric you've identified and combine them into a single score. Define thresholds, i.e. what makes someone highly engaged, moderately engaged, or disengaged.
You can simplify this process by integrating with your CRM platform or customer success tools.
The net promoter score (NPS) is a metric taken directly from your customers. To get it, send out a short survey (or include it in a particular stage of your product's usage). Ask your clients to rate their experience on a scale of 1-10 with this question: "How likely are you to recommend [your product/company/service] to a friend or family member?". You can ask for a brief explanation of the chosen score for more qualitative data.
Customers are classified according to what score they gave you:
Your total NPS only considers the extremes: promoters and detractors, since the passives are, well, passive.

Track this metric over time to see whether customer satisfaction scores improve or worsen. When scores go down, send out additional surveys to see what you should change.
The activation rate is the percentage of users who reached an activation point out of those who signed up. This tells you whether your users are engaged enough to successfully adopt your product.

We already talked about revenue retention, but customer retention isn't the same.
It's, quite simply, the number of customers at the end of a period compared to the number of customers at the beginning of that period. Meg Gowell, Director of Growth Marketing at Appcues, says, "Just a 5% increase in retention rate can boost your profitability by a whopping 25%."

This metric can refer to both the customer churn and revenue churn rate. The first term covers customer attrition over a period, including downgrades or subscription cancellations. You can track this monthly, quarterly, or annually. We recommend looking into the churned personas to identify problematic groups and trends – this can help you target your product better.
Customer churn rate = # of churned customers in a period / # of total customers at the beginning of that period
Tip: For a % illustration, simply multiply the result by 100.
As you can probably tell, the customer churn rate closely correlates with revenue churn, i.e., the revenue lost in a timeframe.

This ratio, expressed in a percentage format, shows your effectiveness at turning leads into paying customers. If this number is low, you should work on your lead nurturing and sales process.

This formula also considers time. For factual insight, use the number of customers and leads from the same month, year, etc.
🤑 Pro tip: Enriching this data with information on which campaigns and channels new customers come from is super valuable. That way, you can double down on those with the highest success rate, optimizing your resources as you go.
We realize how all that can seem like a lot of information to take in. That's why we have just the solution to simplify it.

Fuelfinance is a cloud-based financial department in a transparent, even fun, package. It's essentially a combination of a financial management solution and an outsourced CFO. You get clean spreadsheets and graphs illustrating your financial health and helping you make the best business decisions to grow while staying profitable.
We automatically pull the key SaaS metrics from your accounting software via our built-in QuickBooks integration. That means that instead of wasting time gathering, copying, and organizing data, you can spend it on creative, wise decision-making. Rest assured knowing that your reports always include up-to-date information, without the risk of data silos, manual mistakes, or missing important stats. Fuelfinance gives you neat, visual performance summaries in the all-in-one dashboard screenshotted above. We even suggest exactly which KPIs need tracking based on your business model.
The cherry on top is the fractional CFO you get with the plan. That's right – a dedicated financial expert handles your case to guide you through what can seem like a tricky maze of tracking performance metrics and running a SaaS company.
If you're a pre-seed-stage startup founder looking for a simple solution to scale and attract investors, we've got you covered, too. Our Bootstrap product is tailor-made for you. You can use it for generating financial reports and quick, easy planning. The best thing is – the manual data input version is accessible for free. You can always upgrade to get automatic actuals or add on expert outsourced financial services.
In the meantime, if you want to dive further into KPI tracking, go ahead and read our article, where we cover more agency metrics and how to calculate them.
Although all these equations may have brought back maths class nightmares, you'll quickly realize they're not that frightening. We dare say, you might start loving them when they prove the success and profitability of your business, along with customer success. Plus, we're here whenever you need help tracking these key SaaS metrics.
With Fuelfinance, you don't have to worry about data collection, input, and organization. We do all that and top it off with an in-depth financial analysis. You get your key SaaS metrics available at a glance, making managing your business finances a walk in the park.
Don't be shy – schedule a demo call to learn how Fuelfinance can help you become the new SaaS giant.
And May The Profit Be With You💚
SaaS metrics are performance indicators of software-as-a-service companies. These benchmarks are a clear, objective way to tell if you're successful. They're also a base for making data-driven growth decisions and finding strategy issues before they escalate dangerously.
The 5 Cs for SaaS companies are these financial metrics:
SaaS businesses typically track things like unit economics metrics, NPS, CES, CSAT (customer satisfaction score), customer retention and activation rates and monthly active users.
The Golden Rule, or the Rule of 40 in a SaaS business model, is a premise that your revenue growth and profit margin combined should be at least 40%. Not reaching that number may cause cash flow issues. Hitting a higher result means you're evolving sustainably.


Just imagine how that would transform your team’s productivity and focus? Talk to our financial experts to know more.