Meet Fuel MCP: talk to Claude about any financial decision


If you’ve ever stared at a messy spreadsheet, watching the formulas break as your startup financial model crumbles under pressure — congrats, you’re in the club. It’s where founders spend hours patching together P&Ls, wondering if that last-minute pivot just nuked their cash flow.
Maybe you’ve tried setting up automated financial reports, a few scripts, some clunky templates, but you’re still knee-deep in version history, trying to remember which tab is up to date. Meanwhile, decisions can’t wait. Investors want answers. And your burn rate isn’t going to slow itself down.
Here’s the good news: you don’t need to be a spreadsheet wizard to get accurate, real-time financial reports. Automation isn’t some luxury reserved for Fortune 500s — it’s the lifeline for companies trying to grow without flying blind.
In this guide, we’ll walk through what automated financial reports are, how they help you stay on top of your numbers without becoming a spreadsheet janitor and which tools are worth using.
Manual reporting eats up time and slows down decision-making. Here's why automated financial reports are worth the switch:
Manual reporting? Hard pass. Here’s how startup teams get their numbers in order — fast, clean and fully automated with Fuelfinance, our FP&A tool made by financial experts to automate your financial reports and help with financial planning.
Plug in your tools — QuickBooks, Xero, your CRM, ad accounts, spreadsheets, the works. With 300+ integrations baked in, Fuelfinance pulls your data together behind the scenes. No more chasing numbers across tabs or waiting on manual exports.
Skip the Excel gymnastics. Our finance experts will build dashboards tailored to your business — from P&L and cash flow to balance sheets and custom KPIs — so you get exactly the financial metrics that matter, no setup needed on your end.

Schedule reports to send themselves — weekly, monthly, quarterly, you name it. Or just log into your dashboard and get the latest numbers in real time. No digging through folders. No emailing someone with the file named “Finance_v6_FINAL_FINAL.xlsx.”
Need to compare plan vs actual? Model a new hire or price change? Built-in budgeting, scenario planning and AI forecasting features let you tweak and test without breaking a thing. Your reports keep up, even when your strategy shifts.
Let’s explore some more automated financial reports tools in detail.
Fuelfinance stands out for how seamlessly it connects data and delivers clarity, fast. It’s a financial planning and analysis (FP&A) tool that automates your reporting workflow from the moment you connect your tools. It pulls data from platforms like accounting platforms, HubSpot CRM and more, syncing everything into one system without manual data entry.
Once set up, it generates key financial reports that you can send automatically or check anytime through interactive dashboards. If you prefer spreadsheets, this dedicated financial reporting software offers structured Google Sheets models built with proper formulas, business logic and pre-set KPIs that match your company’s revenue model, expense categories and forecasting needs.
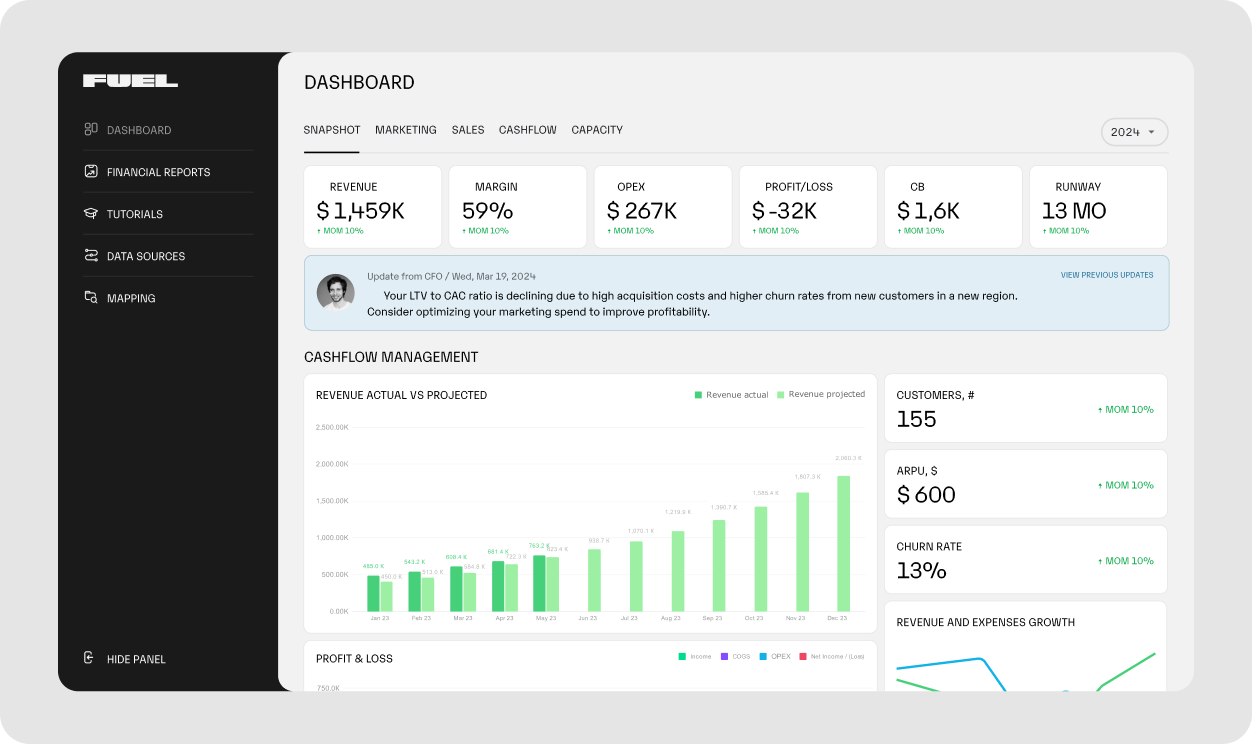
Dashboards are customized to your business model, showing key agency metrics like cash runway, revenue breakdowns and team expenses. Plan vs actuals, budgeting and AI forecasting tools are built in, helping you adjust quickly when plans shift.
👉 Book a demo and let Fuelfinance turn your finance chaos into clean, automatic, investor-ready reports
Testimonial Hero, a fast-growing B2B video production agency, was juggling finance across Airtable, QuickBooks and HubSpot. Reports were slow, manual and full of gaps. There was no real-time visibility, no clear cash flow tracking and zero insight into unit economics.
After switching to Fuelfinance, their data was integrated and automated. Profit and loss statements, cash flow reports and balance sheets now update in real time. They gained a clear dashboard showing key metrics like CAC, LTV and margins. Even better? They cut finance costs by 50% while getting 2–3x more strategic value through proactive CFO-level support.


Datarails is built for finance teams that still live in Excel but want their reporting process to run faster and smoother. It connects to your accounting tools, CRMs, ERPs and spreadsheets, pulling everything into one place so you’re not chasing numbers across platforms.
Once your data’s in, it handles the behind-the-scenes stuff (consolidations, currency conversions, hierarchy management) automatically. You can keep using your existing spreadsheet setup and reports like P&L, cash flow and balance sheets update in real time as the data changes.
Reporting happens either directly in Excel or through Datarails’ own dashboard tool, depending on what works best for your team.
Read also: Datarails competitors
Capterra: 4.8
G2: 4.6

Fathom focuses on turning accounting data into polished, presentation-ready reports. It connects to tools like QuickBooks, Xero and MYOB, automatically pulling in financials and updating them behind the scenes.
Where Fathom stands out is its structured, template-based setup. Users choose from a library of pre-designed reports, charts and financial statements, then customize layouts using a drag-and-drop editor. Reports are branded, scheduled and shared via link or PDF, making them especially useful for external presentations or board meetings.
Read also: AI financial analysis
Capterra: 4.8
G2: 4.5

Cube is built for finance teams that run everything in spreadsheets but need faster, more reliable reporting. Instead of asking you to ditch Excel or Google Sheets, Cube plugs into them, acting as a connector between your existing reports and live financial data from existing systems like NetSuite, QuickBooks and Salesforce.
Once set up, it syncs data from across your tools, then feeds that into your spreadsheet templates. Reports like income statements, cash flow and budget vs actuals update automatically, using the same logic and structure your team already knows.
Read also: Cube vs Datarails
Capterra: 4.6
G2: 4.5

Vena Solutions centers its reporting automation around Excel, keeping the spreadsheet interface teams are used to, while adding cloud-based data integration, scheduling and workflow automation.
It connects to financial systems like ERPs, CRMs and accounting systems to consolidate data into a single source. That data feeds directly into linked Excel templates, which populate reports like financial statements, variance analyses and dashboards automatically. Reports can be scheduled for recurring delivery and routed for review or approval as part of a built-in workflow.
Read also: Vena competitors
Capterra: 4.5
G2: 4.5

Planful helps automate financial reporting by pulling complex financial data from tools like NetSuite, SAP, Oracle and others into one centralized platform. Once everything is connected, reports like budget vs actuals, management summaries and financial statements are generated automatically and always reflect the most current data.
You can build reports using drag-and-drop templates, customize them for different teams or stakeholders and set them to go out on a schedule. Dashboards update in real time and users can dig into the details or run ad-hoc analysis without IT help.
Read also: Planful competitors
Capterra: 4.3
G2: 4.3
If you're still spending hours in spreadsheets trying to generate reports, track cash flow or explain numbers to your team, it's time for a change. Automated reporting tools take that load off your plate. But most of them stop at templates and charts.
Fuelfinance goes further. It doesn’t just automate your monthly reporting — it brings in real-time data, performs advanced financial analysis and helps you make sense of complex data without adding more work to your week. You get timely reports, plan vs actual insights and forecasting tools that let you test different growth scenarios on the spot.
The best part? You don’t have to set it all up alone. Our team combines tech, financial know-how and custom setup so your reports match your business model.
If you're ready to stop guessing and start understanding your company's financial health, Fuelfinance is the most complete, AI-powered solution out there.
👉 Book a demo and see how easy it is to generate reports that move your business forward.
Yes, financial reporting can be fully automated using the right financial reporting software. These tools handle data collection, report generation and updates in real time, helping you stay on top of your numbers and track business performance without manual work.
To a degree. With the right integrations, Excel can pull in up-to-date data and automate some report generation. However, for more scalable and accurate reporting and automation, especially with increasing data volumes, dedicated financial reporting software offers better control and efficiency.
The four main types of financial reports are: balance sheets, income statements (also known as profit and loss statements), cash flow statements and statements of shareholders’ equity. These reports work together to show your financial performance, financial position and how money moves in and out of your company.
The best financial reporting software depends on your business size, needs and growth plans. Look for a tool that automates data collection and report generation, delivers up-to-date data and provides valuable insights to drive business growth and data-driven decision-making (like Fuelfinance!).


Just imagine how that would transform your team’s productivity and focus? Talk to our financial experts to know more.