Meet Fuel MCP: talk to Claude about any financial decision
Interactive, real-time finance dashboard visuals your whole team can understand, so everyone’s aligned and every decision is data-backed.
See It Live
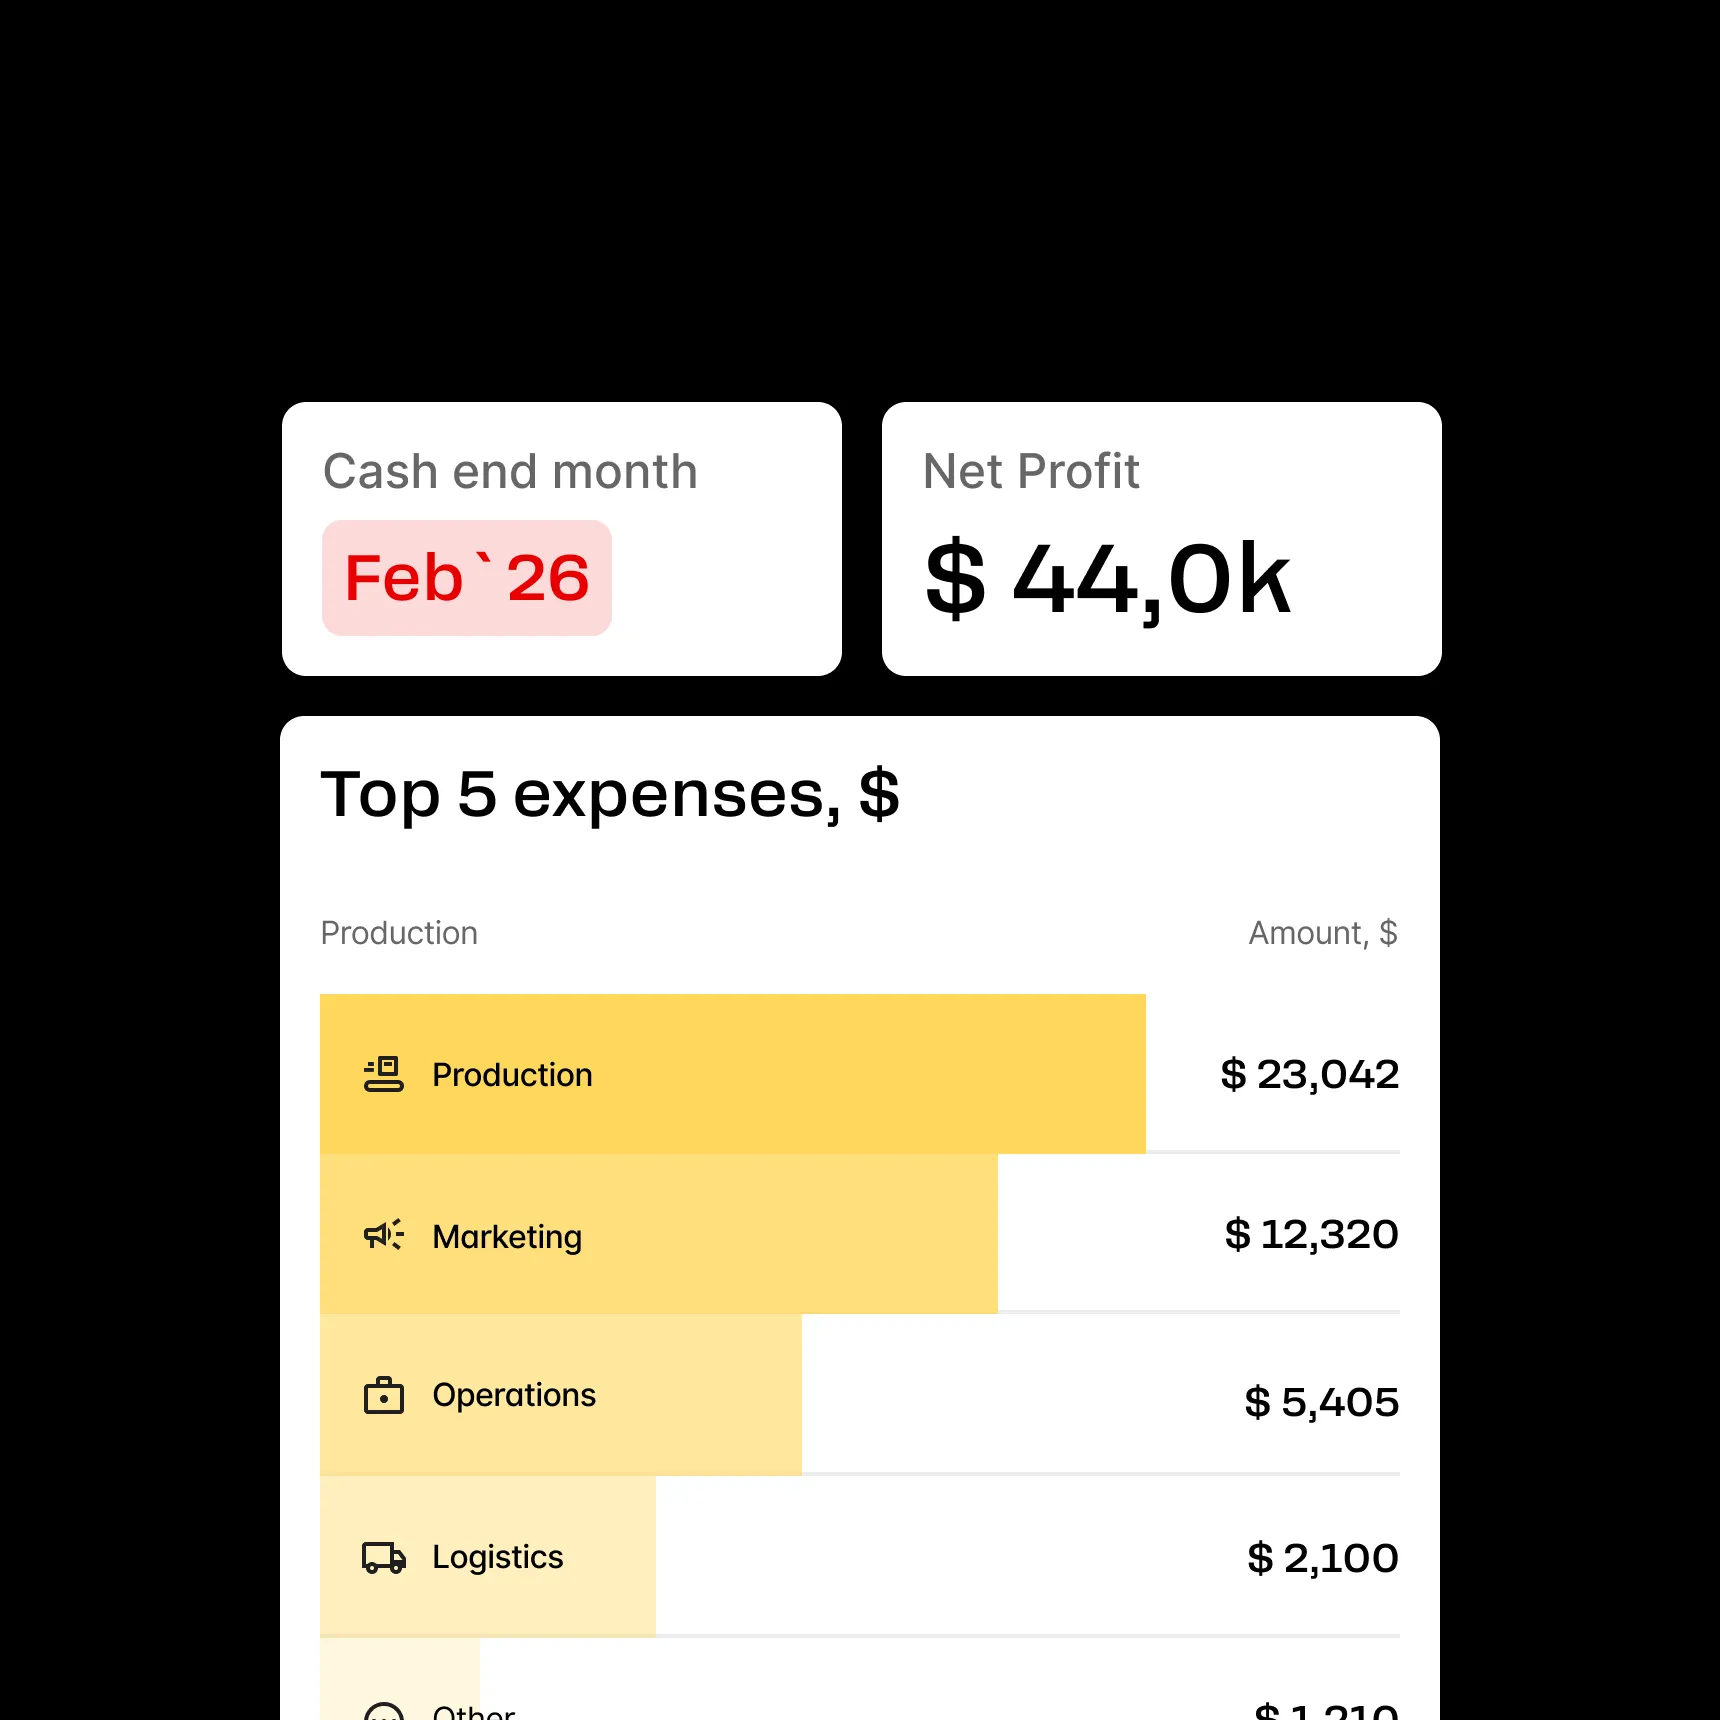
See what’s really behind the chart. One click shows the formula, data, and transactions driving every KPI.

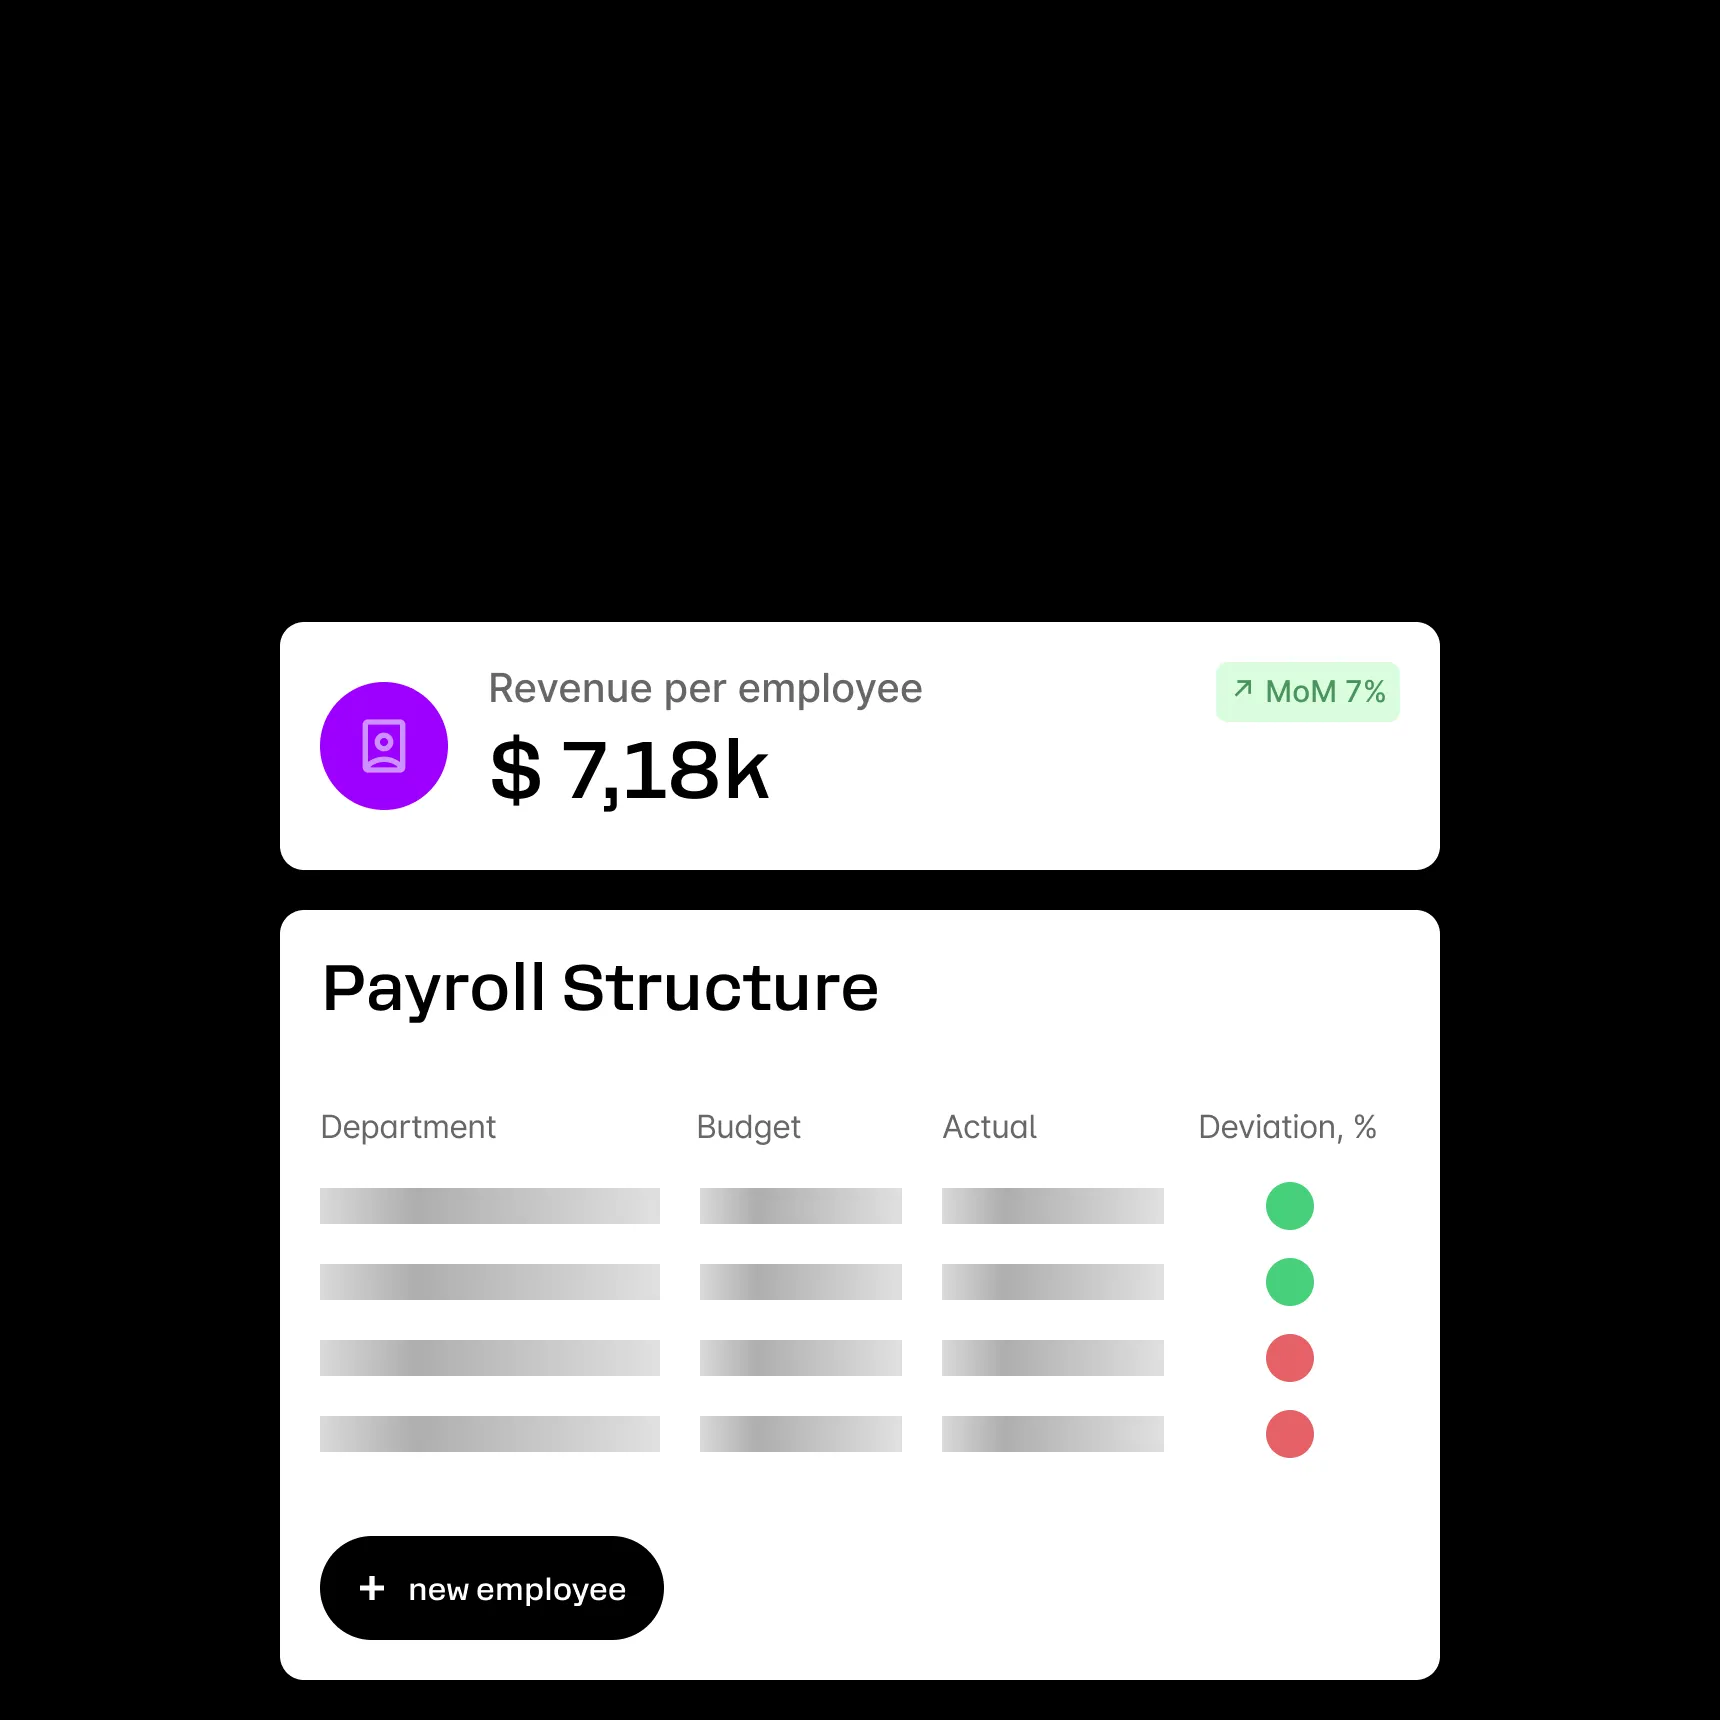
Not everyone needs every number. Create role-based views so each stakeholder sees what matters to them.

Add custom charts, metrics, or dashboards straight from chat in seconds.AI builds the reports you need. No code. No setup pain.
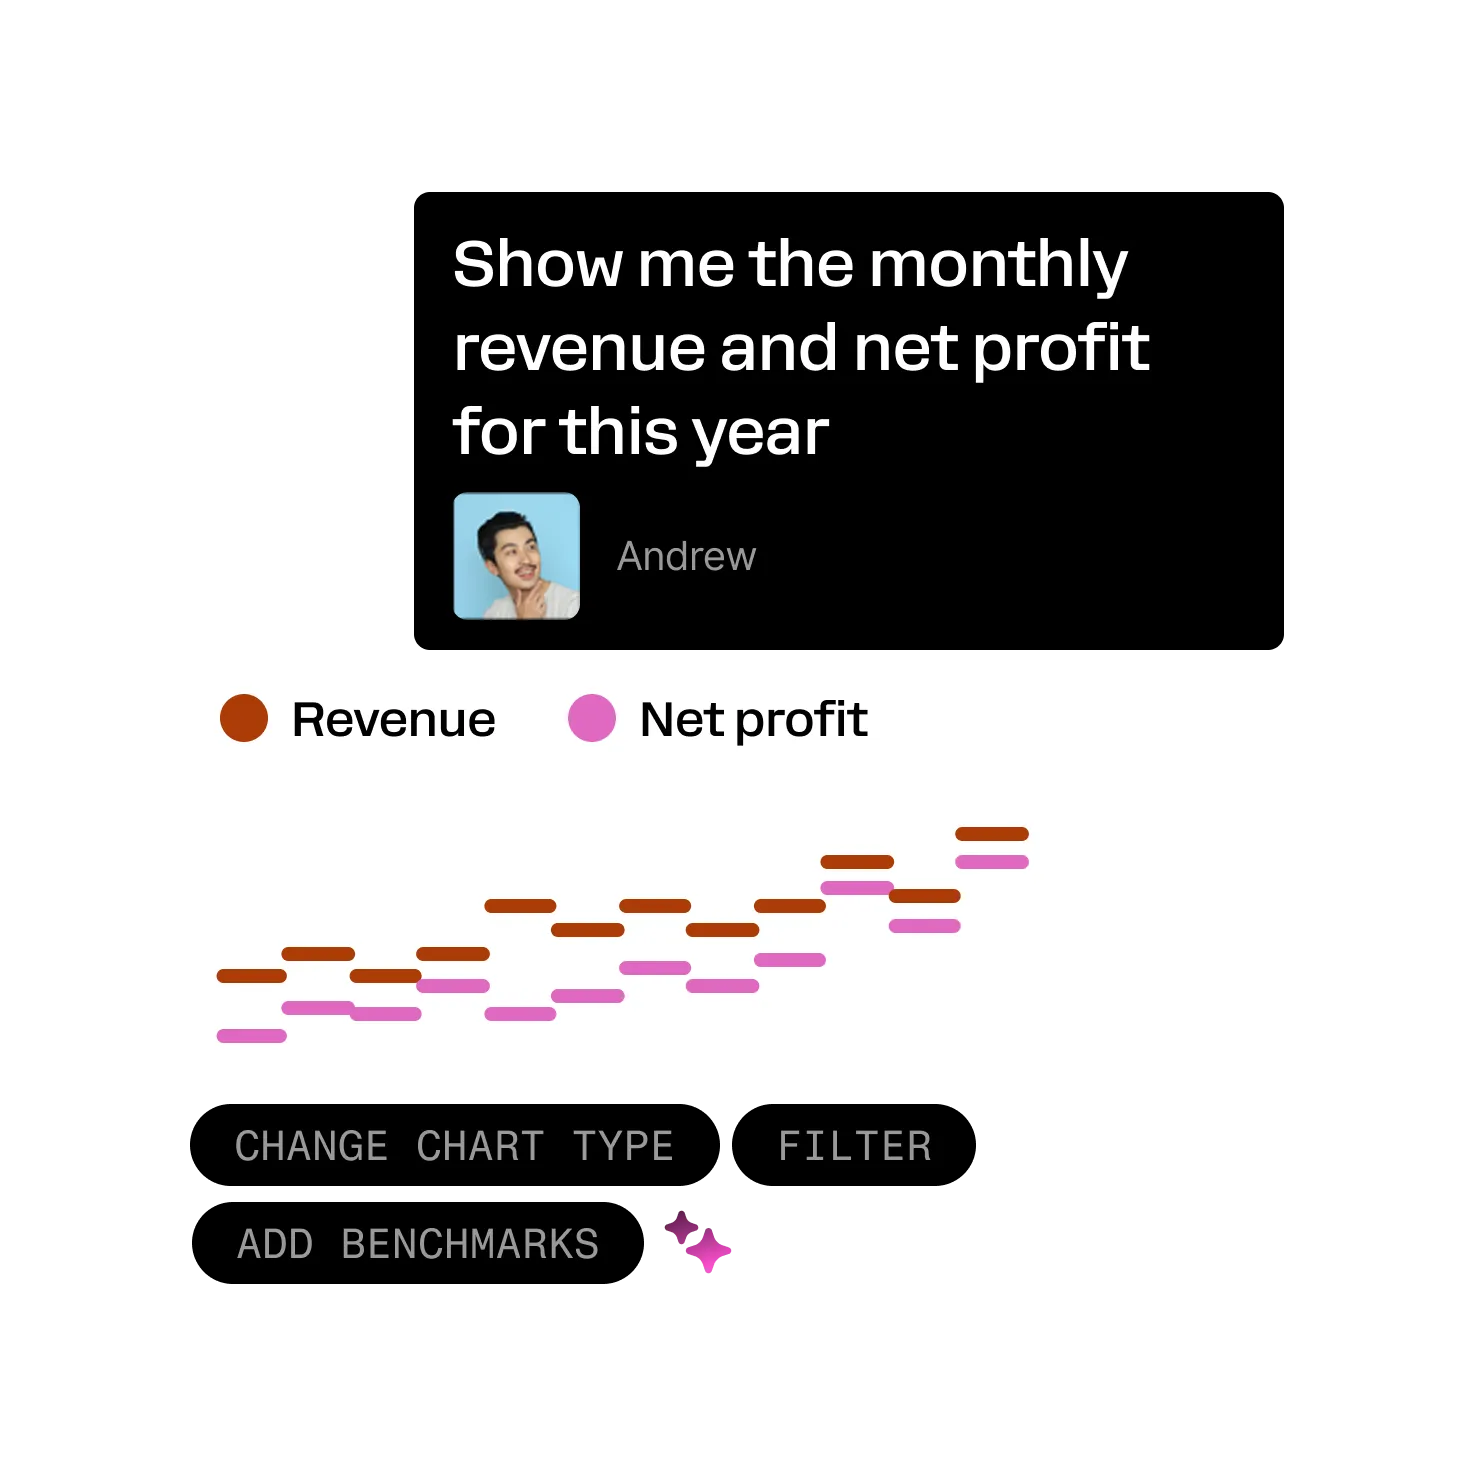
Fuel connects 300+ tools so you can play with your data anytime - create charts, reports, and metrics instantly, and make decisions in seconds.

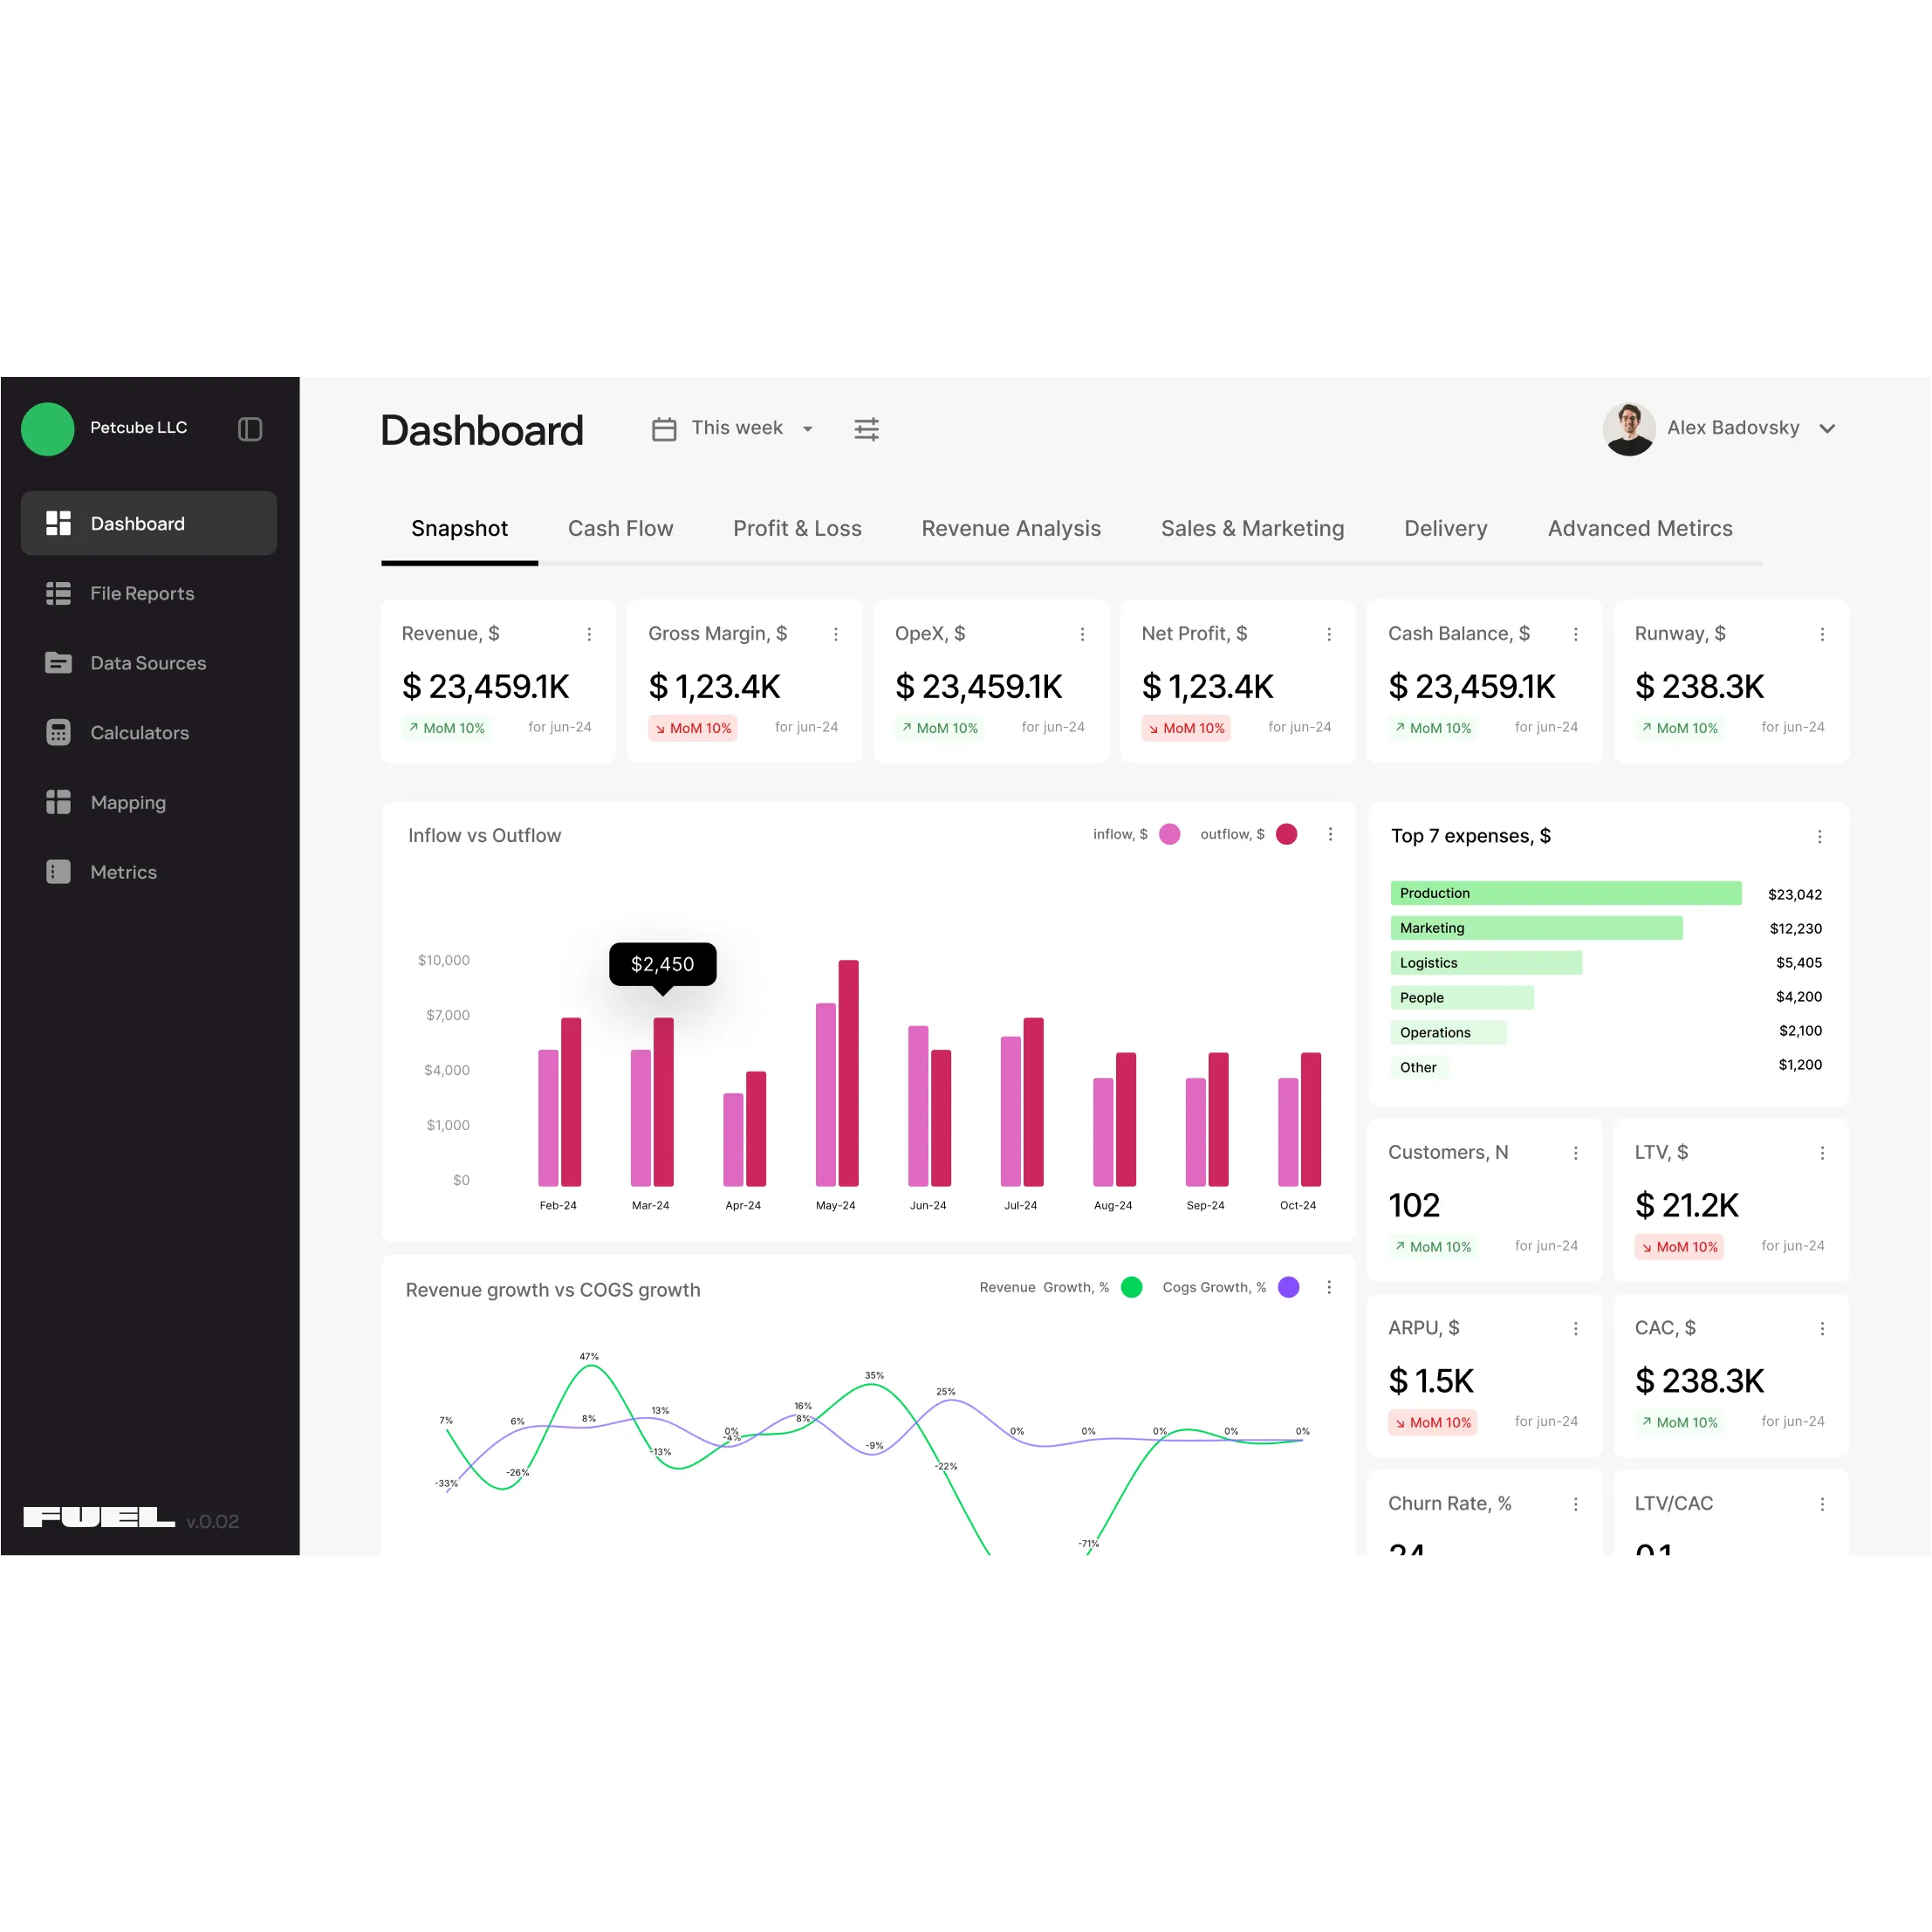
Fuel dashboards connect your actuals, forecasts, and unit economics in real time — giving you one source of truth that’s both team-friendly and board-ready
Yes, you can add or change metrics in seconds using AI or with help from your Fuelfinance Slack support.
Yes. You control who sees what: execs, finance, investors, or individual teams.

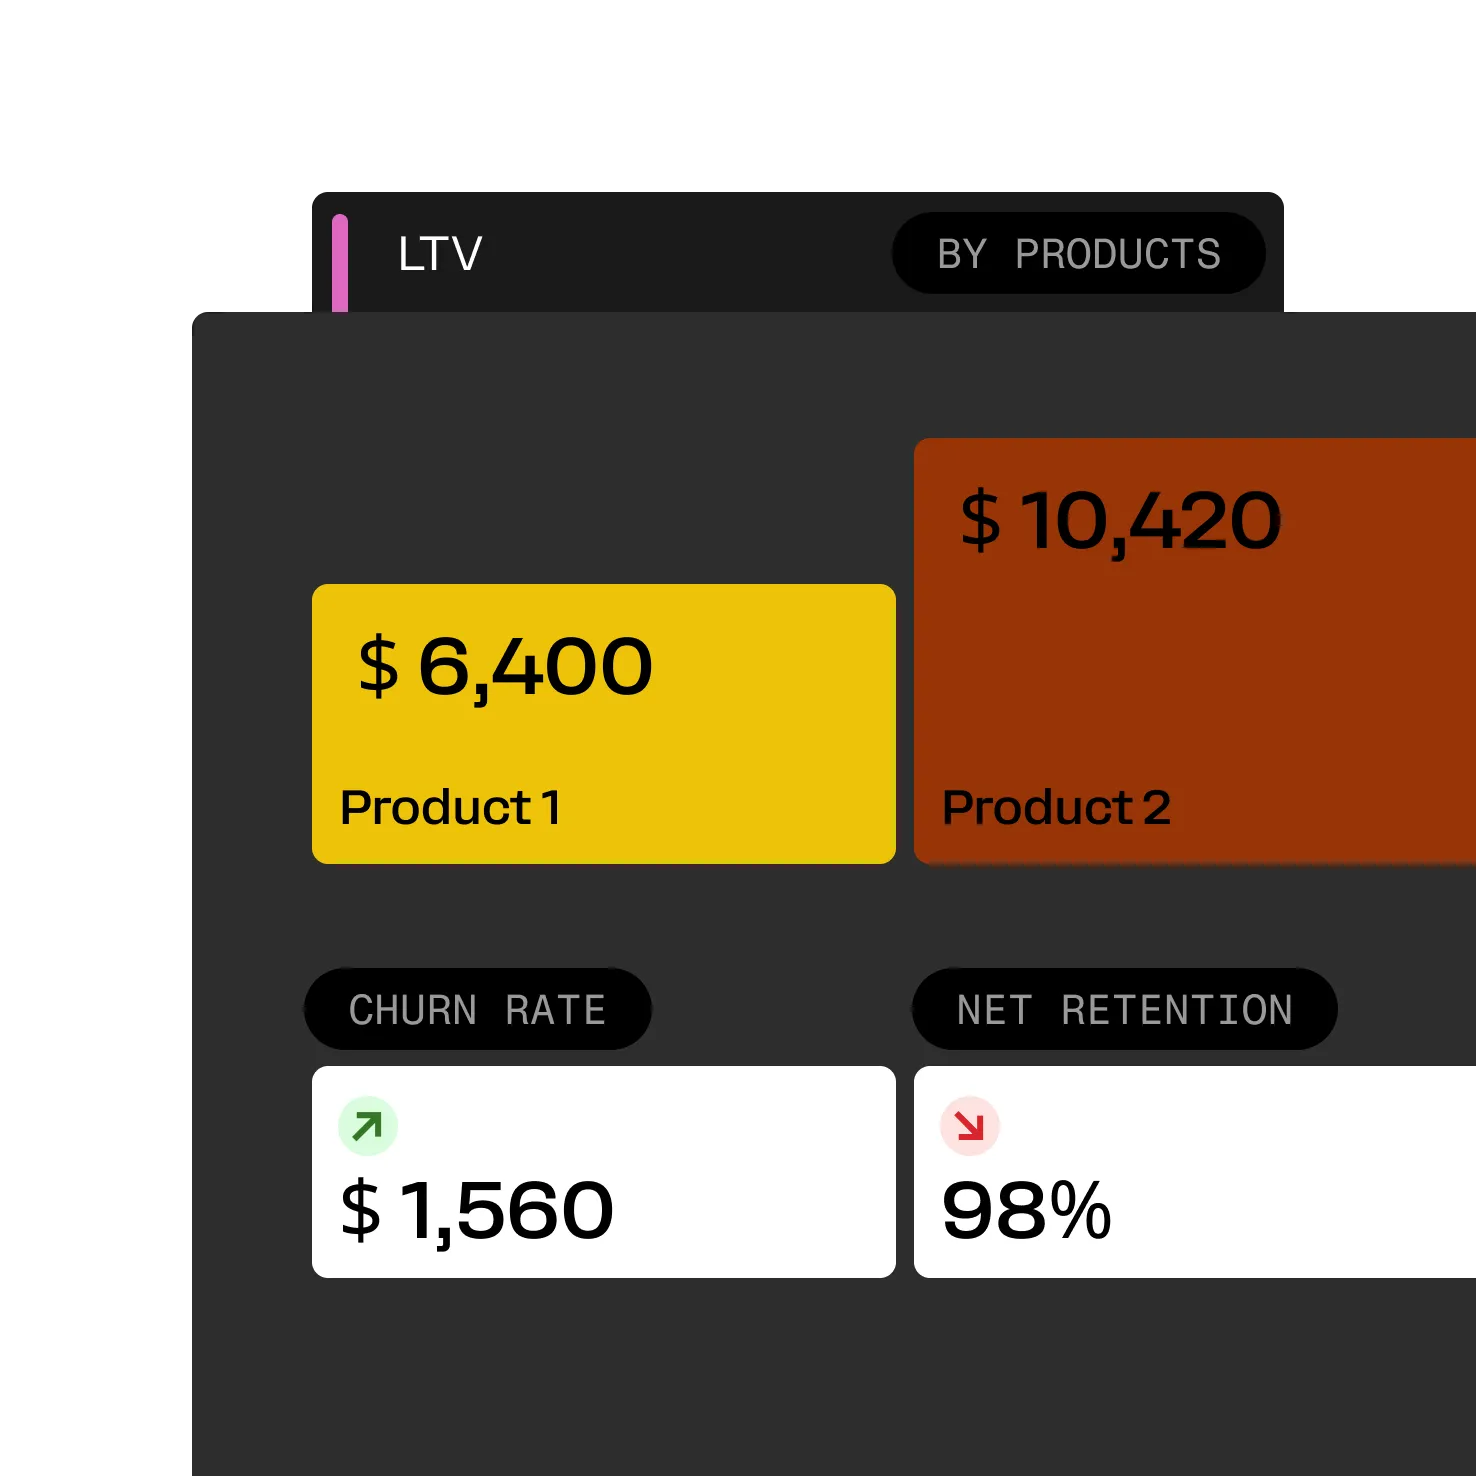
From CAC and LTV to burn rate and ROI, everything you need to run your business.

Fuel syncs with your tools: QuickBooks, Stripe, HubSpot, and more. No manual uploads needed.


Sam Shepler
CEO at Testimonial Hero
Sam Parr
Founder of Hampton
 Case study

Alex Vacca
Co-Founder and COO at ColdIQ
Ian Myers
Founder & CEO at Oceans
 Case study
Book a free demo to explore Fuelfinance dashboards that turn messy data into clear, actionable insights. Make faster, smarter decisions — all in one place.
Book a demo