Meet Fuel MCP: talk to Claude about any financial decision


Does tracking financial metrics while trying to grow your small business feel like juggling a hundred balls? Revenue, expenses, cash flow, profit margins — each one seems important, but you don’t know which ones matter most or what they truly mean.
Should you focus on your sales numbers or operating expenses? Maybe it’s your cash flow that’s really holding you back?
We get it — it’s easy to get lost in all that data and miss what matters for your growth.
That’s why we’re here to help.
Discover 30 key financial metrics for SMBs and how to use them effectively.
These are the numbers that reflect the financial performance of your business.
Here are some of the ways financial metrics help:
If you’re tired of tracking key performance indicators manually, we have good news.
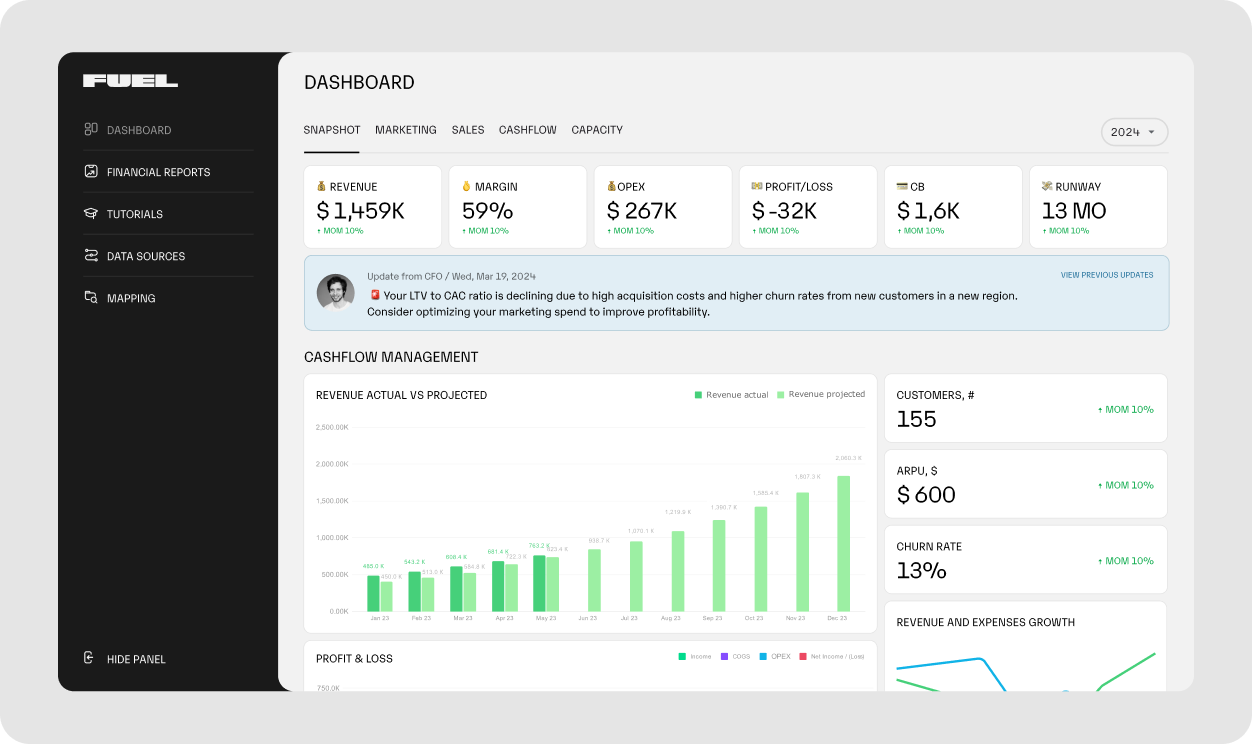
There’s a financial management tool to make it easier — Fuelfinance, a cloud-based financial management solution that simplifies tracking, analyzing and forecasting financial performance. It gives you a real-time dashboard that consolidates all your financial data — cash flow, P&L, unit economics and financial projections in the cloud. Beyond numbers, Fuelfinance also provides expert financial guidance from a dedicated CFO.
Here’s what Fuelfinance helps you track:
Book a demo with Fuelfinance today and take control of your financial future — without the spreadsheet headaches.
Now that you know why you need financial metrics, let's get into which ones to focus on.
Revenue is your business’s total income from selling goods or services. It’s the first figure on your income statement, calculated before any expenses.

Note: Revenue doesn’t necessarily mean you have that much cash in hand. It’s recorded when a sale occurs, even if you’re still waiting on customer payments.
This metric shows how much money you keep after covering production costs, like manufacturing expenses and wages for employees involved in production.

It helps you understand how profitable your core business activities are (e.g., a clothing brand’s core activity is making and selling clothes, while a SaaS company’s is developing and selling software).
This and GPM sound alike, but they measure different things.
The net profit margin shows how much of your revenue turns into profit after covering all expenses, like production costs, taxes etc.

Fuelfinance gives you a monthly Profit and Loss (P&L) statement. Our awesome financial reporting software shows your net profit margin and all the key numbers that impact it.
EBITDA shows how much money your company is making before considering things like interest, taxes, or the reduction in value of a company’s assets over time due to use and aging.

For an in-depth look at EBITDA, check out our article on EBITDA vs. Net Income.
This number reflects the percentage of revenue remaining after covering core business expenses like wages, rent and production costs.

If your margin is lower than your industry benchmark, you should cut costs by automating tasks or adjusting your prices.
ROA measures how efficiently your business turns its assets — like equipment, inventory and intellectual property — into profit.

How to improve ROA:
ROE shows how well your company turns shareholders’ investments into profit.

This metric is especially important to investors. The higher your ROE, the more confident they’ll feel about your business, making them more willing to invest.
ROI tells how profitable an investment is, i.e how to use your resources more effectively.

For example, if you run two marketing campaigns — one on social media and the other through email — and each campaign costs the same, calculating ROI for each will help you see which brings more sales. Then, you can focus on a more effective campaign to get better results without increasing your marketing spend.
OCF shows how well your business is making money from everyday activities.

It lets you know if you’re bringing in enough to cover your bills and still have some left to invest in growth.
FCF measures the cash left after operating costs (e.g., salaries and rent) and expenditures (e.g., buying new equipment).

With the Fuelfinance, business budgeting software, you can easily track both your operating and free cash flows.
Take ColdIQ’s experience, for example. They use the Fuelfinance financial planning software tool to track cash flow and get insights from P&L and balance sheet reports. Our financial planning software tool helps them spot cash shortages, plan reinvestments and meet financial obligations on time. As a result, they grew their revenue by 236%, increasing from $67K MRR to $250K MRR.
If you want similar results, book a demo with Fuelfinance to see the difference it can make in your financial planning.
CCC tells you how well you handle customer payment times and inventory turnover.

If your CCC is long, it could be a sign to adjust your payment terms.
The current ratio compares all your current assets to liabilities due within a year.

A strong current ratio (1.2–2) means you have enough assets to cover your short-term debts without extra funding.
The quick ratio checks if your company can quickly cover short-term debts using assets that turn into cash fast. These liquid assets include cash, stocks and money from customers.

This shows how your company balances borrowed money and investor capital to fund growth.

A good debt-to-equity ratio depends on the industry. We generally advise keeping it below 2.
ICR shows if your company generates enough earnings to cover its debt costs and invest in market research or expanding production.

The cash burn rate is your top concern; it shows how much you spend (burn) to keep things running.

Net burn rate = Total monthly cash from sales - Total monthly cash expenses
To take some pressure off, here’s some expert advice straight from Fuelfinance CEO Alyona Mysko to help you start reducing your burn rate:
“- Link rising expenses to increasing revenue. E.g., consider hiring or spending $10k more if revenue hits $100k next month.
- Check all your monthly expenses closely. Ask yourself: What’s the purpose of this expense? What changes if we cut it?
- Budget and analyze monthly expenses for better results next month.
- Before you decide on expenses, consider their impact on your runway. Is it worthwhile?
- Check all your software subscriptions; do you need them all?”
The runway shows how long your company can keep operating before running out of cash at your current burn rate.

Check out our Runway Calculator.
CAC represents how much it costs you to get a new customer.

Knowing your CAC helps you choose the best marketing channels. For example, you can compare the CAC of paid ads and SEO to see which one costs less to get a customer. Lower CAC by refining sales strategies to target high-value customers.
CLV estimates how much money a customer will spend with your business over time.

*LT = 1 / Monthly churn rate (%)
CLV shows you how much you can invest to acquire new customers while ensuring a profitable return.
The LTV/CAC ratio shows how much a customer is worth over time versus how much it costs to bring them in.

At Fuelfinance, we use the LTV/CAC ratio to calculate your company’s unit economics. This tells you how much revenue and cost each unit brings in. Depending on your business, a unit could be a product, service or customer.
This way, we can tell you which products or customers bring the most value and contribute the most to your growth so that you can focus your efforts on them.
RPC shows how much money, on average, each customer brings to your business.

Understanding RPC helps you identify upsell and cross-sell opportunities, maximizing revenue from existing customers. If RPC is low, you might need to adjust pricing, offer higher-value products or introduce premium tiers to increase revenue.
The churn rate is the percentage of customers lost over a specific period (e.g., in a month or in one year).

Minimize churn rate by improving support or offering better loyalty rewards and value for price.
NRR shows how much revenue you keep from your existing customers over a certain period, like a month or a year.

If your NRR drops, it’s a sign that it’s time to adjust your pricing or how you engage with customers to motivate them to spend more.
Accounts receivable turnover evaluates how efficiently your company receives payments from customers who purchase on credit.

If your accounts receivable turnover is low, review your payment terms to speed up collections.
Accounts payable turnover shows how efficiently your company pays suppliers.

A high APT means you’re paying suppliers quickly, which may indicate strong cash flow — but could also mean you’re missing opportunities to optimize payment terms.
A low APT suggests delayed payments, which could free up cash but might strain supplier relationships or signal financial struggles.
Working capital measures your company’s ability to cover its short-term expenses. It’s the difference between what the company owns (cash, money customers owe, products) and what it owes (bills, wages, short-term debt).

Positive working capital means your business has enough cash to cover daily expenses, e.g., bills and wages. It also means you can invest in growth, like launching new products.
Negative working capital signals cash flow problems, making it harder to pay bills or invest in growth.
The break-even point tells you how much you need to earn to cover all your costs. Knowing this metric helps you determine the minimum sales you need to make to ensure profitability.

It measures how much your sales have increased (or decreased) over time.

A low or negative growth rate signals potential issues like market saturation, pricing problems or ineffective sales strategies.
Forecast accuracy tells how well your financial forecast aligns with your actual results.
We made the Fuelfinance AI Forecasting for this.
It pulls figures from your accounting software and sales reports to predict your revenue and expenses for the next 12 months. Test different scenarios and see how they affect your finances.
The baseline scenario shows what will likely happen with your revenue and cash flow if things stay as they are. The target scenario shows you how to achieve the growth you want. This gives you accurate predictions, helping you make the best decisions, whatever life throws at you.
This is precisely what Oceans achieved with Fuelfinance financial forecasting software. They reduced the gap between their predictions and actual results from 50% to just 5–10%!
Budget variance shows the difference between what you expected to spend or earn and what really happened.

To go a step further, assess the reasons behind your business’ budget variance with a plan vs actual analysis. Compares how much you expected to earn and spend (“plan”) to what you really did (“actual”).
Fuelfinance is the best financial planning and analysis software for your plan vs actual analysis. You can go through this analysis weekly, bi-weekly or monthly to learn from the past and find ways to grow and perform better each month.
Book a demo to analyze your budgets and spending today
It can be hard to stay on top of all your financial metrics, especially when starting or scaling your business.
That’s what Fuelfinance is here for.
It’s your complete small business financial management solution, created by experts who’ve worked with hundreds of SMBs.
Along with tracking key metrics on your personalized dashboard, reliable AI forecasting and receiving detailed statements, Fuelfinance offers even more to help you stay on top of your company's financial health:
Hundreds of small businesses are already using Fuelfinance capabilities to drive growth. One of them is Testimonial Hero, whom we’ve helped automate financial data syncing and make accurate financial reports. Consequently, they reduced finance and accounting costs by 50% while doubling their interest income. Sam, the founder of Testimonial Hero, is happy to share:
“We cut our costs in half, we’re getting way more, and I can sleep way better at night!”.
It’s time for you to get better sleep, too — book a demo with Fuelfinance to get started.
We all know that tracking financial metrics and KPIs helps drive business growth. But we can also agree that it’s not always easy.
That’s why we created Fuelfinance.
It automatically pulls data from over 350 integrations into one easy-to-use dashboard. You get real-time insights into your metrics without spending hours on manual tracking and calculations. AI forecasting gives you a clear view of your financial future and helps you choose the best moves for the best results.
You also get monthly P&L, Cash Flow and Balance Sheet statements to help you track progress, compare results and improve. Plus, you’ll always have expert guidance to help you keep your finances organized and your business growing.
Book a demo with Fuelfinance to take control of your finances today.
Financial metrics are numbers that show a company’s financial performance.
This depends on your business needs and focus. For most businesses, the starting point is revenue, profit margin and cash flow.
The three categories of financial metrics include revenue & profitability metrics, cash flow & liquidity metrics and customer & revenue efficiency metrics.
Financial KPIs include metrics like EBITDA, ROI and burn rate, to name a few.


Just imagine how that would transform your team’s productivity and focus? Talk to our financial experts to know more.