Financial Reporting Software for QuickBooks: Top 7 Tools 📊
Alyona Mysko
Founder of Fuelfinance | building the future of finance for SMBs
February 26, 2026
Managing your business finances in QuickBooks makes sense — until you need deeper insights into your bookkeeping data. When your business starts growing and you need actual insights on what to do with your finances, QuickBooks’ reporting capabilities fall short.
Enter financial reporting software. When you sync them with QuickBooks, they automatically clean up the mess and give you real-time visibility into your numbers, pulling in all your transactions and turning them into deep financial insights.
In this post, we’ll explore seven financial reporting software for QuickBooks and what makes each one worth considering.
Top 7 financial reporting software for QuickBooks for deeper insights
Fuelfinance
Fuelfinance is a financial planning and analysis software that helps startups and small businesses manage reporting, forecasting and budgeting (without hiring a whole finance team).
Connecting Fuelfinance to QuickBooks is simple and secure. Just log into QuickBooks through the Fuelfinance dashboard (no passwords are shared) and authorize access — it doesn’t take more than five minutes. Once connected, Fuelfinance pulls in key data like invoices, bills and transaction details.
The system syncs automatically once daily to keep your reports current, but FP&A managers can also trigger manual imports anytime they want.
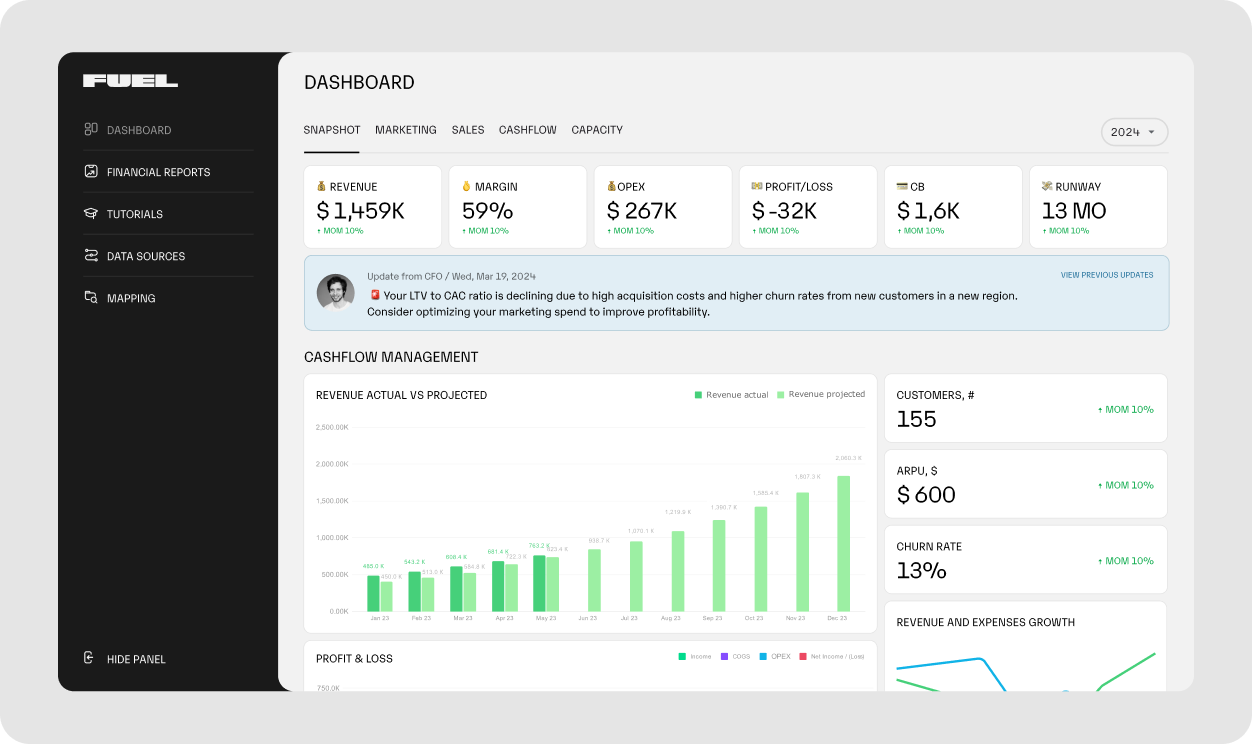
Once the data is in, Fuelfinance builds all core financial reports — profit and loss, cash flow and balance sheet — and adds deeper layers like unit economics, CAC, revenue projections and cost per employee.
To keep things digestible, Fuelfinance’s dashboards highlight the most critical KPIs first — cash runway, burn rate, margins — and then give you access to more detailed views if you need them.
Fuel runs $500M+ in P&L for service companies like Endeavor. See it in action!
Key financial reports: P&L, cash flow, balance sheet — the whole trio, built automatically from your QuickBooks data.
Custom dashboard: Say goodbye to confusing tables and hello to a dashboard built for real people (not accountants). Fuelfinance shows the numbers that matter most for your business model — whether you’re SaaS, services or somewhere in between.
Daily cash flow tracking: QuickBooks won’t show you how your cash is moving day to day — Fuelfinance will. You get a clear, daily breakdown so you can spot dips, plan payments and avoid surprise shortfalls.
AI forecasting and scenario planning: Fuelfinance builds financial forecasts based on your real data. You can generate baseline, target and worst-case scenarios in one click, then compare them against your real results over time.
Unit economics and performance metrics: Want to know your CAC? LTV? Revenue per employee? Done. Fuelfinance pulls financial and operational data together to show what’s working, what’s wasting money and where to focus next.
Expert support: Every account comes with a dedicated FP&A manager. They’ll be your fractional CFO and will walk you through your reports, flag red flags and help you remove the “What am I looking at?” sentence from your vocabulary.
When Hampton, a private CEO community, started scaling, their reporting tools couldn’t keep up. QuickBooks gave them the basics, but the reports were rigid, hard to interpret and scattered across different platforms.
After integrating Fuelfinance with their QuickBooks, Stripe and other tools, Hampton got a custom-built reporting system that lives in one Google Sheets workbook. The result? A fully automated setup that includes cash flow, P&L, budgeting, forecasting and unit economics — all tailored to how the business runs.
Thanks to Fuelfinance, they now save up to 24 hours per month on reporting tasks and spend less than an hour monthly providing input. Most importantly, their leadership team can finally make decisions based on clear, structured financial insights.
Datarails
Datarails is a financial planning and analysis platform built for teams that manage their finances in Excel but want to automate budgeting, forecasting and reporting. It acts as an Excel add-on, letting users continue working in their existing spreadsheets while layering in automation and collaboration tools.
It connects with QuickBooks to pull in detailed financial data such as transactions, account balances, invoices and budget figures, helping teams combine information from multiple sources into a single view.
Key features
Scenario planning: Datarails lets teams build multiple financial scenarios using their existing Excel models. You can adjust variables like revenue growth, hiring plans or cost assumptions and instantly see how changes impact cash flow, profit margins or runway.
Automated reporting: Datarails connects to QuickBooks and other data sources to pull in actuals, budgets and forecasts. Reports are updated automatically on a set schedule (typically monthly), and all the data is pulled together into one place. They can include dynamic tables, charts and commentary.
AI-powered assistant: FP&A Genius is Datarails’ built-in AI chatbot that answers questions like “What was our CAC last quarter?” or “How does Q1 revenue compare to last year?” using your live financial data. It also provides quick insights into trends, variance explanations and budget analysis.
Storyboards and presentations: Datarails can convert financial data into visual reports combining charts, commentary and slide-style formatting. These are great for board meetings or investor updates, allowing teams to communicate financial results or forecasts in a clean, easy-to-follow format.
Fathom is a financial management tool for businesses that want to track performance metrics and create visual reports. It connects directly to QuickBooks, importing financial data to generate customizable dashboards, reports and forecasts.
The financial reporting software is commonly used by companies managing multiple entities or locations. It supports unified reporting and KPI tracking across different business units.
Key features
Customizable templates: Fathom allows users to design report templates tailored to different audiences, from internal teams to investors. You can choose which KPIs to highlight (like gross margin, revenue growth or net profit), add company logos, and tweak layouts to fit your brand or reporting style.
Unified reporting: For companies with multiple entities, Fathom can unify data from each into a single report. It handles different currencies and charts of accounts and can perform eliminations where needed.
Benchmarking and KPI tracking: Users can set targets or view industry benchmarks to evaluate business performance. KPIs like EBITDA or net income, revenue per employee or customer acquisition cost can be tracked over time, flagged when they fall outside of thresholds.
Scenario modeling: Fathom’s Goalseek tool lets users test “what-if” scenarios by changing variables such as sales growth, headcount or expenses.
Customer reviews
Capterra: 4.8
G2: 4.5
Syft Analytics
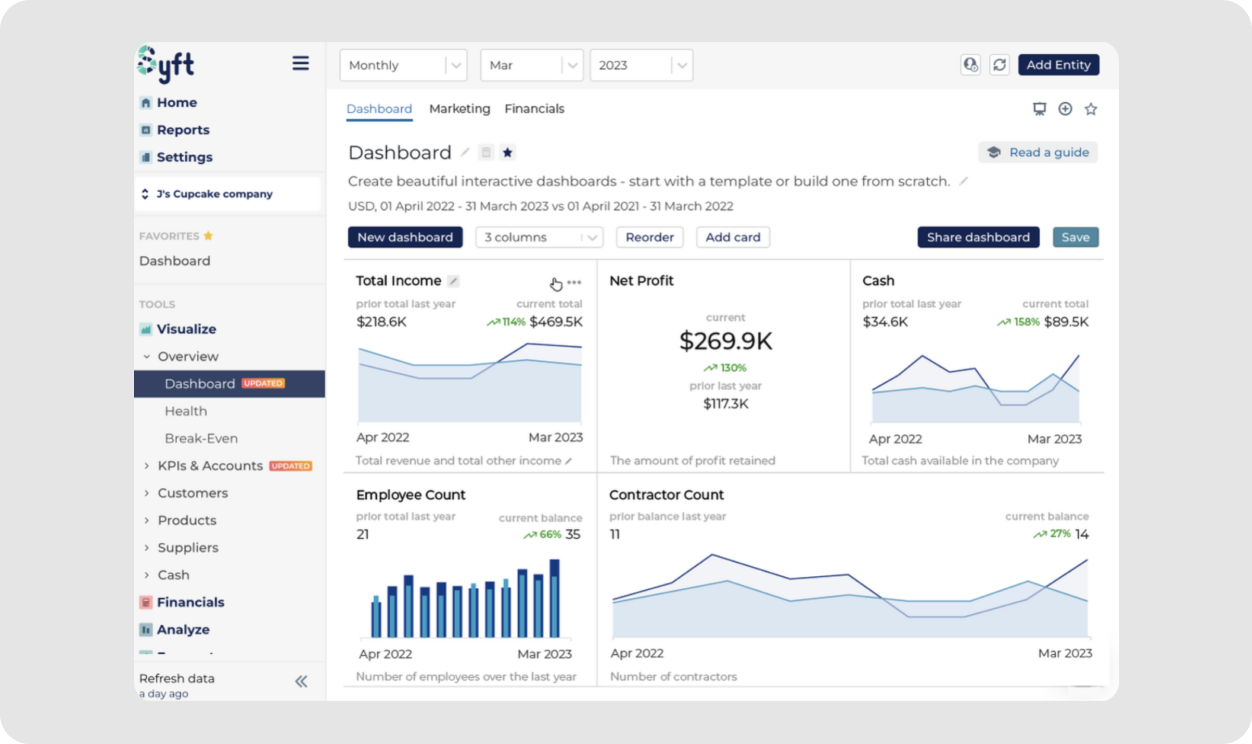
Syft Analytics focuses on turning accounting data into structured, visual reports. It’s often used by finance teams that need to bring together information from multiple sources or entities and present it in a clearer, more interactive format.
It integrates with your QuickBooks online account to automatically sync data, including transactions, journals and invoices. Once connected, users can create dashboards, build custom reports and run forecasts across different timeframes or business units.
Multi-entity integration: The platform supports reporting across multiple entities and currencies. It connects data from different QuickBooks Online accounts, supports various currencies and automates inter-company eliminations.
Custom dashboards: Dashboards in Syft can be tailored to show the metrics that matter most to your business, like revenue trends, expense breakdowns or gross margin. Users can create visualizations using charts, graphs and scorecards, and segment data by period, business unit or account type.
Cash flow forecast: Syft offers short-term cash flow projections by analyzing past cash movements and expected income or expenses. You can model different payment timelines, plan for upcoming costs and monitor available cash to avoid shortfalls or improve working capital management.
AI insights: The platform’s AI features scan reports for anomalies, trends or patterns, such as sudden revenue drops or unexpected expense spikes. It surfaces these insights within the dashboard or report view and provides context based on historical data.
Customer reviews
Capterra: 4.7
G2: 4.8
Reach Reporting
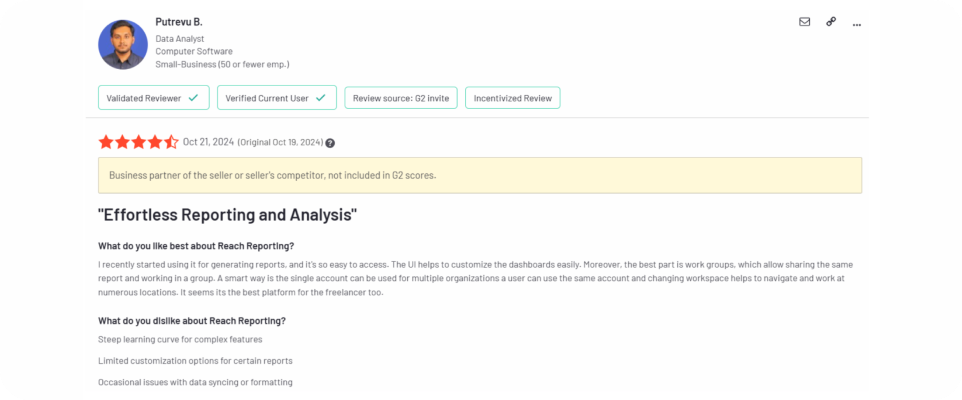
Reach Reporting is a reporting and forecasting tool for businesses, accountants and financial advisors to build financial reports and dashboards based on real-time accounting data. It connects with platforms like QuickBooks to automate reporting workflows and reduce manual data entry.
Once integrated with QuickBooks, Reach syncs financial data such as transactions, budgets and account balances. From there, users can create custom dashboards, track KPIs and build reports that bring together numbers from different entities.
Key features
Three-way forecasting: The platform supports integrated forecasting across P&L, balance sheet and cash flow, using QuickBooks real-time data as the base. Users can input assumptions like revenue growth, hiring plans or expense changes to model different financial outcomes.
Multi-entity financial consolidation: Reach Reporting can merge data from multiple QuickBooks files or company departments into a single report. It supports different currencies and automatically eliminates inter-company transactions.
Data storytelling: The platform allows users to transform financial data into presentation-ready reports with custom branding, visuals and narrative elements. You can include interactive charts, callouts for key metrics and commentary blocks to explain trends.
AI financial analysis: The system includes AI tools that scan your synced accounting data to detect variances, flag irregularities and summarize key trends. These insights are embedded directly in your reports.
Qvinci is a financial reporting and data consolidation tool designed for organizations that manage multiple entities, such as franchises, accounting firms and nonprofits. It connects with QuickBooks to centralize financial data across locations, files or business units.
Once integrated, Qvinci syncs historical and current data from QuickBooks, standardizes it using a unified chart of accounts and lets users build reports that connect results from across locations. You can also track performance by location and compare financials side by side.
Key features
Data consolidation: Qvinci pulls financial information from multiple QuickBooks files and merges it into a single dashboard. Whether you're managing dozens of franchise locations or multiple nonprofit chapters, it allows for centralized reporting without manually combining spreadsheets.
Standardized chart of accounts: When each entity has a slightly different setup in QuickBooks, Qvinci standardizes account structures using a master chart of accounts. This ensures reports are aligned and comparable across locations.
Benchmarking and analysis tools: Qvinci offers side-by-side comparisons across units, periods or budgets. Users can run variance analysis to see where performance is falling short, and generate “health check” reports that flag key financial risks or deviations from targets.
Budget vs. actual reporting: The platform pulls budget data from each QuickBooks file and compares it against actual performance in real time. Users can view results by location, department or across the entire organization.
Customer reviews
Capterra: 3.8
G2: 3.5
Spotlight Reporting
Spotlight Reporting is a cloud-based financial reporting tool used by accountants, advisors and businesses to build detailed reports and forecasts. This financial reporting software for QuickBooks automates data syncing and simplifies financial management across multiple entities.
Once integrated with QuickBooks, Spotlight pulls in financial data, including transactions, budgets and account balances, and uses it to generate visual dashboards and forecasts.
Key features
Three-way forecasting: Spotlight Reporting includes integrated forecasting tools for cash flow, profit and loss and balance sheet statements, allowing users to model financial outcomes and compare different planning scenarios.
Custom charts: The platform includes over 100 chart types to help visualize trends, KPIs and variances. Examples include cash flow waterfall charts that break down inflows and outflows, trend graphs for historical performance and KPI scorecards to track financial and operational metrics side by side.
Account groupings: Users can group accounts flexibly to simplify reports for different audiences. For instance, you might group several revenue accounts into one line for a board presentation or break out specific cost categories for a department manager.
Benchmarking and analysis: Spotlight lets you compare entities or departments across key metrics like gross margin, revenue growth or net profit. Built-in “health check” tools flag underperforming areas or unexpected performance changes, helping finance teams focus on what needs attention.
Best financial reporting software for QuickBooks compared
Integration
Key features
Best for
Rating
Fuelfinance
Key financial reports Custom dashboard Daily cash flow tracking AI forecasting and scenario planning Unit economics and performance metrics Expert support
Turning QuickBooks data into strategic decisions with expert-backed insights and AI forecasts
Capterra: 5 G2: 4.9
Datarails
Scenario planning Automated reporting AI-powered assistant Storyboards and presentations
Excel users who want to automate planning and stay in spreadsheets
Capterra: 4.8 G2: 4.7
Fathom
Customizable templates Unified reporting Benchmarking and KPI tracking Scenario modeling
Creating visual performance reports and unified metrics
Capterra: 4.8 G2: 4.5
Syft Analytics
Multi-entity integration Custom dashboards Cash flow forecasting AI insights
Multi-entity reporting and AI-assisted analysis
Capterra: 4.7 G2: 4.8
Reach Reporting
Three-way forecasting Multi-entity consolidation Data storytelling AI financial analysis
Spreadsheet-style dashboards and real-time reports
Capterra: 4.9 G2: 4.8
Qvinci
Data consolidation Standardized chart of accounts Benchmarking and analysis tools Plan vs. actual reporting
Franchises and multi-location businesses needing standardization
Capterra: 3.8 G2: 3.5
Spotlight Reporting
Three-way forecasting Custom charts Account groupings Benchmarking and analysis
Accountants and advisors delivering advisory reports
Capterra: 4.3 G2: 4.7
Ready for financial peace of mind?
QuickBooks is great at keeping your books in order, but when it comes to tracking performance, planning or making sense of what’s really happening in your business, its reporting can fall short. That’s where the right tools make all the difference.
Adding financial reporting software for QuickBooks can help you centralize numbers, monitor key metrics and make faster, smarter decisions, without jumping between spreadsheets or second-guessing your Google Sheets data.
Among all the available options, Fuelfinance offers the most complete setup. It pulls your data directly from QuickBooks, organizes it into a clear, visual dashboard and adds powerful forecasting and expert guidance — whether you’re syncing your QuickBooks online subscription, using QuickBooks desktop or still managing everything in Google Sheets. Fuelfinance connects with all three, giving you one place to track performance, plan ahead and stay in control of your finances.
Book a free demo and see how Fuelfinance can improve your financial health, sharpen your strategy and give you back control — without the spreadsheet headache.
FAQs
Is QuickBooks a financial reporting software?
QuickBooks includes built-in tools to create essential reports like Profit & Loss, Balance Sheet and Cash Flow, but it's primarily accounting software. It also supports automated reporting, basic customization and integrates with advanced tools for deeper analysis.
How do I get financial reporting from QuickBooks?
Log into QuickBooks, go to the “Reports” tab and select the type of report you need. You can customize it by date, account or class, then export it or schedule it to run automatically.
Why don't accountants like QuickBooks?
Some accountants find QuickBooks limiting for complex businesses. It may lack advanced customization, detailed audit trails or multi-entity reporting found in enterprise-level tools. Mistakes from untrained users can also lead to messy data.
Can QuickBooks do financial statements?
Yes, QuickBooks generates key financial statements like Profit & Loss, Balance Sheet and Cash Flow. These can be customized and exported. However, for more advanced reporting, many business managers opt for additional financial reporting software for QuickBooks.