Meet Fuel MCP: talk to Claude about any financial decision


Here's what separates thriving businesses from struggling ones: 87% of insight-driven companies anticipate fast expansion this year, while nearly four-in-five have an extremely clear understanding of their cash flow. The difference? They don't just track numbers — they turn financial data into strategic advantage.
You could have the most innovative product on the market, but without crystal-clear financial reporting, you're flying blind. Potential investors will hesitate. Partners will question your stability. Even your own team will doubt critical decisions when the numbers don't tell a coherent story.
The companies experiencing double-digit growth right now have mastered one crucial skill: transforming raw financial data into compelling business narratives. This guide reveals exactly how to create financial reports that do more than satisfy compliance requirements — they become your hacks for securing investment, building stakeholder confidence, and making the data-driven decisions that fuel sustainable growth.
By the end of this article, you'll have everything you need to create professional financial statements that actually help you make better decisions (and never embarrass yourself in front of investors again).
Think of your business's financial report as your business's report card — but way more useful than the ones you got in school. It's a structured document that summarizes your company's financial performance over a specific period, showing exactly where your money came from, where it went, and what you have left.
Unlike basic accounting records that just track transactions, a business's financial statements and reports transform raw financial data into actionable insights. They help you understand whether your business is healthy, growing or heading for trouble — and they provide insights into your company's profitability in a format that everyone from employees to investors can understand.
Here's why financial reports matter:
Here's a quick finance management system video that shows how finance management works as a system — from the first recorded transaction to product planning and pricing.
The main thing you need to know is that effective financial planning isn't about perfect predictions — it's about creating systems that help you adapt quickly to your actual numbers when reality doesn't match your projections. And that you need to ace reporting, planning and analytics if you want to perfect strategic finance management.
Your income statements, particularly your profit and loss statement, are the most important financial reports you'll create. It shows whether you made money or lost money over a specific period — and more importantly, it shows exactly how that happened.
If you’ve ever dieted, treat it as your business's calorie counter. Just like tracking calories shows you which foods help or hurt your health goals, your P&L shows you which revenue streams and expenses help or hurt your profitability.
Your P&L breaks down your company's financial performance into digestible pieces. You can see if your company's revenue is growing, if operating expenses are under control, and if you're actually generating net profit or just burning cash with style.
Check out this P&L Statement Explanation Video for an in-depth explanation.
Your financial P&L follows accounting rules and focuses on compliance. Your managerial P&L focuses on decisions. For example, a financial P&L might lump all marketing expenses together, while a managerial P&L breaks them down by channel, campaign, and customer acquisition cost.
For small businesses and startups, we recommend the managerial version because it shows you granular breakdowns of exactly which activities drive results.
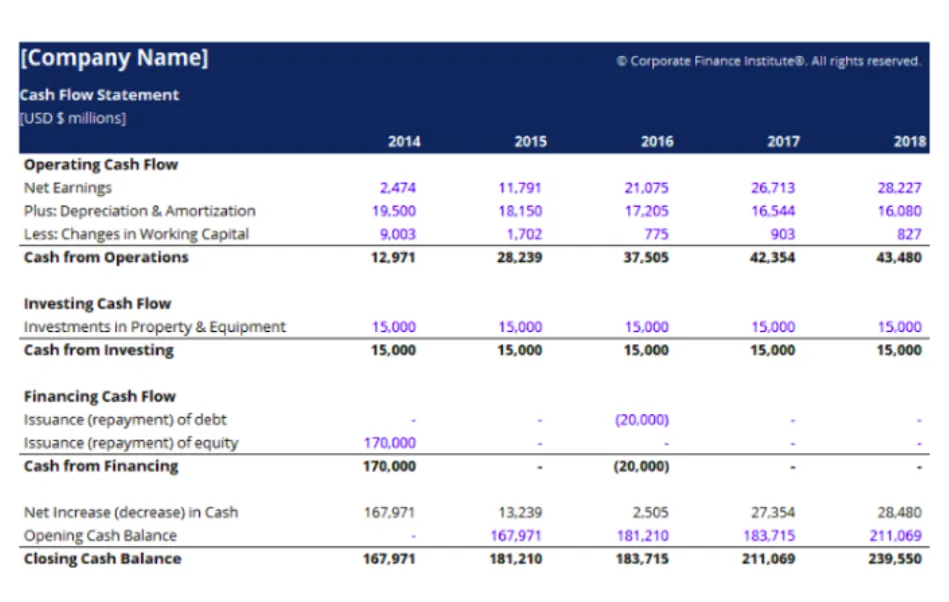
Cash is king. While your P&L shows profitability, your cash flow statement shows liquidity — whether you have enough cash inflow to pay bills, invest in growth or survive a rough month.
Profitability and cash flow statements are different animals. You can be profitable on paper, but run out of cash because customers pay slowly or you're investing heavily in inventory. That's why cash flow forecasts and financial statements track the actual movement of money in three categories:
Your balance sheet is a snapshot of everything you own (assets), everything you owe (liabilities), and what's left over (shareholders' equity), including critical metrics such as your debt-to-equity ratio.
The Fuelfinance cash flow & balance sheet video shows how this is possible.
The magic happens when you read these reports together. Your P&L might show strong net income, but if your cash flow is negative and your balance sheet shows mounting debt, you've got problems brewing.
Unit economics break down the fundamental math of your business model. Instead of looking at total revenue and expenses, unit economics show you the profit and loss on a per-customer, per-product or per-transaction basis.
For a SaaS company, unit economics might track:
For an e-commerce business, it might be profit per order, return rate impact or shipping cost efficiency.
Unit economics reports are particularly valuable for small businesses because they reveal whether your business model actually works at scale. You might be profitable overall, but if your unit economics are broken, growth will eventually kill you.
This is where advanced financial analysis software becomes super valuable — it can automatically calculate and track unit economics across different customer segments, products and time periods.

Here's where theory meets reality. Let's look at actual financial report samples from Fuelfinance that real businesses use to track performance, make decisions and communicate with stakeholders.
Your monthly financial report is your business's vital signs check-up. It shows you whether things are trending up, down or sideways — and catches problems before they become emergencies.
Here's what a solid monthly financial report includes:

For small businesses and startups, monthly financial reports should focus on cash management, growth metrics, and effective resource allocation rather than complex accounting details. You need to know if you can make payroll, if customer acquisition is working, and if you're burning money too quickly.
The key is making these reports actionable. Instead of just saying "revenue was $50k last month," your report should explain whether that's good (vs your $45k target), concerning (vs your $60k forecast), or part of a seasonal pattern.
This detailed guide walks you through a founder's monthly financial routine — it shows you exactly how to use monthly reports for better decision-making.
Annual reports are your business's highlight reel and reality check combined. They show long-term trends, celebrate wins, acknowledge challenges, and set the stage for the coming year.
Unlike monthly reports that focus on immediate decisions, annual reports help you understand the bigger picture. They reveal patterns that monthly financial projections might miss — like seasonal revenue cycles, the true cost of customer acquisition over time or how profitability changes as you scale.
Annual reports serve double duty as investor updates and board presentations. They need to tell a compelling story about your company's performance while being transparent about challenges and realistic about future opportunities.
Good reporting, quarterly or annually, can be used to compare your performance to industry standards. For SaaS companies, this might mean comparing your churn rate, CAC payback period, and net profit margins to public SaaS companies or industry surveys.
Budget vs actual reporting is where financial planning meets financial reality — and where most businesses discover that their original assumptions were, well, optimistic.
These reports help you understand which parts of your business are predictable (and should be managed tightly) versus which parts are inherently variable (and need flexible planning).
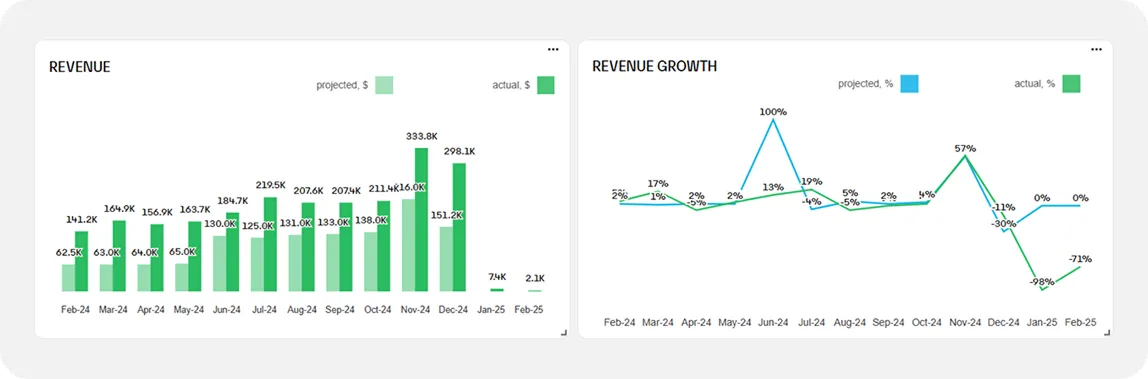
Modern budget vs actual reports connect financial performance to operational metrics. For example, if revenue is below budget, the report should show whether it's due to fewer customers, lower prices or delayed sales cycles.
Here are some practical resources for better budgeting:
The goal isn't perfect budget accuracy (that's impossible). Rather — fast learning and quick adjustments based on what reality teaches you about your business model.
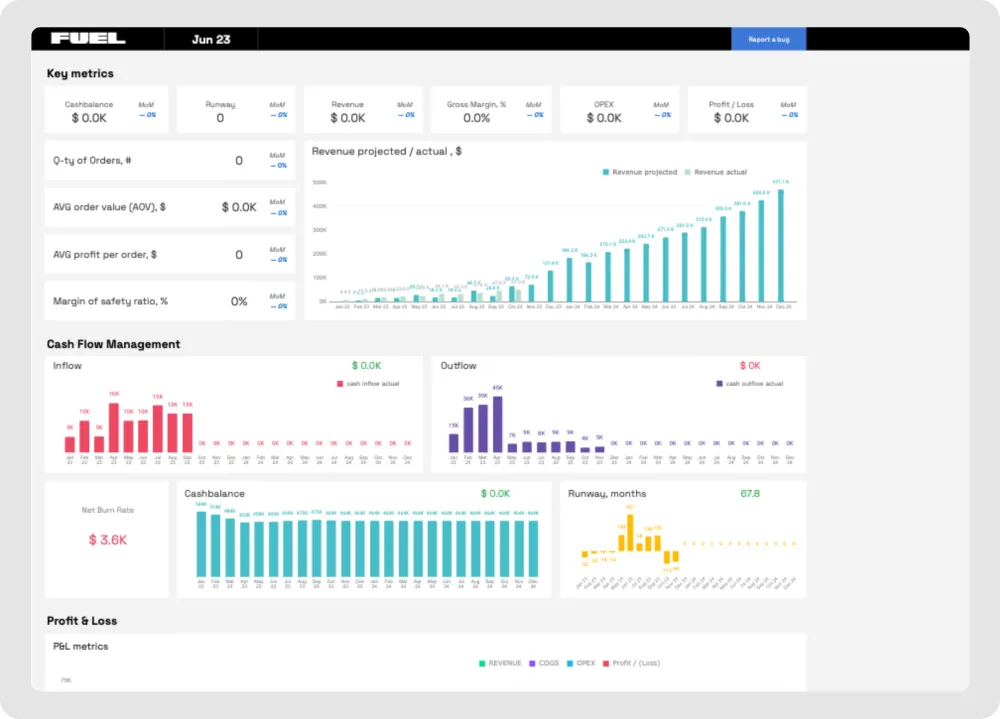
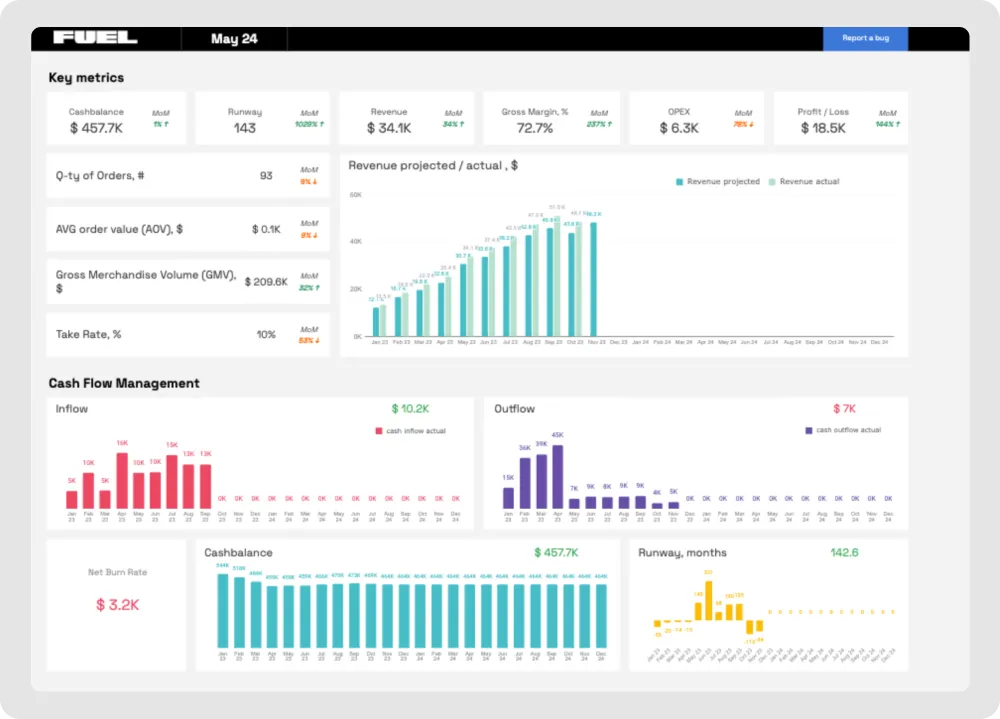
Financial dashboard software transforms static reports into dynamic, visual command centers for your business. Instead of scrolling through spreadsheets, you get real-time insights that help you spot trends, identify problems and make decisions faster.
Think of your CFO dashboard as your business's cockpit. Just like pilots need to see altitude, speed and fuel levels at a glance, you need to see cash flow statements, revenue trends and key ratios without digging through multiple reports.
Modern financial dashboard examples show how visual data presentation can dramatically improve decision-making speed and accuracy.
Professional services businesses have unique financial characteristics that generic templates often miss. Unlike product companies, your biggest expenses are people, and your revenue is tied to billable hours, project completion and client relationships.

E-commerce businesses deal with inventory, shipping costs, return rates and seasonal fluctuations — and all need specialized financial reporting approaches.
Software-as-a-service businesses arguably have some of the most complex unit economics, but also the most predictable revenue streams once you understand the key metrics.
Your financial statements should connect directly to key SaaS metrics like net revenue retention, customer lifetime value and monthly recurring revenue growth rates.

Marketplace businesses (think Airbnb, Uber or e-commerce platforms) face unique financial reporting challenges because they facilitate transactions between parties while taking a percentage of the transaction value.
Creating financial reports that actually help your business (instead of just satisfying accountants) requires a systematic approach. Here's the exact process we use with small businesses and startups to build reports that grow companies.
Financial data collection is kind of like cooking — the quality of your ingredients determines the quality of your dish. Garbage data creates garbage insights, no matter how pretty your charts look.
Start with your core systems. Most businesses have financial data scattered across multiple tools:
The challenge isn't so much accessing this data as it is organizing it consistently. Create a standard chart of accounts that aligns with your business model.
Instead of manually collecting data from dozens of sources, Fuelfinance's financial management tools integrate with 300+ business tools. This means your financial data updates automatically, and you spend time analyzing instead of data entry.
See also: Top 8 Brex Integrations: Connect Your Finances 😌
Choosing the right template is about matching your reporting format to your business model and decision-making needs.
See also: 📑 What’s the Right Financial Model Template for Your Startup Stage?
If you’re looking for ways to automate your financial planning, the best financial planning software tools can automatically generate appropriate templates based on your business model and industry.
Report structure is the difference between a gripping book and a thought-dumping journal.
Start with executive summary insights, then provide supporting details. Your audience should understand the key takeaways within 30 seconds, then have the option to dive deeper into specific areas.
Fuelfinance financial reporting software automatically applies consistent formatting and creates visual hierarchies that guide readers through complex financial data.
Raw financial data tells you what happened. Analysis and insights tell you why it happened and what to do about it.
Don't just report that revenue was $100k last month. Explain whether that's above or below target, how it compares to seasonal patterns and what drove the performance. If revenue exceeded expectations due to a one-time deal, that's different from sustainable growth.
Look for patterns across multiple time periods. Is gross margin declining gradually? Are operating expenses growing faster than revenue? Are customer acquisition costs rising while customer lifetime value stays flat?
Here's what AI-powered analysis looks like:
This is where you catch errors, improve clarity and ensure your insights actually help decision-making.
For businesses looking to implement systematic financial reporting processes, Fuelfinance's automated financial reports can handle much of the review and quality control automatically.
Here's what we've covered: financial report samples can become decision-making tools that can give you a clear picture of what makes or breaks your business.
If you take one thing out of this, let it be:
Want to see how this works in practice? Fuelfinance combines AI forecasting, expert support and automated financial reports into one platform that grows with your business. You get real-time dashboards, scenario planning software, and financial projections that actually help you make decisions.
Whether you're a bootstrap startup using our unit economics calculator or a growth-stage company needing comprehensive CFO dashboard capabilities, we've got templates and tools that fit your stage and industry.
Stop flying blind with your finances and find ways to cut costs effectively. Book a demo and see how proper financial reporting can fuel your growth.
It all starts with gathering accurate financial data from all your business systems, then organizing it into a logical structure. Include an executive summary, key financial statements (profit and loss, cash flow, balance sheet), variance analysis comparing budget vs actual performance and projections.
A monthly financial report sample typically includes revenue and expense summaries, cash flow analysis, key ratios like gross margin and customer acquisition cost, budget vs actual variance analysis and cash runway projections. For small businesses, this might be a 2-3 page document showing whether you're on track to hit your goals and highlighting areas needing attention.
Create monthly reports for internal decision-making, quarterly and annual reports for investors or board members, and a comprehensive analysis and strategic planning for financial analysts.
Financial statements are the formal documents (income statements, balance sheets, cash flow statements) that follow accounting standards like GAAP. Financial reports are broader documents that include financial statements plus analysis, insights, key ratios, forecasts and management commentary to support informed decision-making and strategic planning.


Just imagine how that would transform your team’s productivity and focus? Talk to our financial experts to know more.