Blog
January 14, 2024
Alyona Mysko
September 12, 2025

How to Do a Financial Analysis Like a Pro in 4 Steps

When I recently asked, “Who hates doing finance?” at SaaSOpen, almost the whole room raised their hands.

Yet — if your company were a living, breathing organism, its financial statements would be its vital signs. Monitoring them shows your business's financial health, performance and future. There’s no way around it.

Running a business in 2025 isn't getting any easier. According to Gartner, CFOs face slower revenue growth, rising costs and difficulty finding skilled finance talent. Whether you're a founder or finance lead, the pressure is on to make wise decisions — fast.

That’s why we’ve put together a guide on how to do a financial analysis, even if finance isn’t your favorite topic.

This 4-step plan walks you through everything you need: preparing financial statements, tracking metrics and more. And with Fuelfinance in your corner, you don’t have to do it alone.

Let’s break it down so you can do a financial statement analysis like a seasoned CFO.

How to do a financial analysis in 4 steps

There's no need to do things manually when plenty of financial management solutions can help you save time and avoid errors in financial analysis.

Here's how to do it with the help of Fuelfinance, a cloud-based financial forecasting tool that acts like your personal outsourced CFO.

Prepare financial statement reports

Before you can start analyzing financial statements, you need to prepare your financial statement reports. This is the first key step in understanding how to do a financial analysis with clarity and precision.

You can do that manually or using accounting software such as Xero or QuickBooks, but it'd be much more effective to use an all-in-one finance tool such as Fuelfinance that can provide you with more insights and a higher level of automation.

Read also: 5 Best QuickBooks Integrations for Better Financial Management

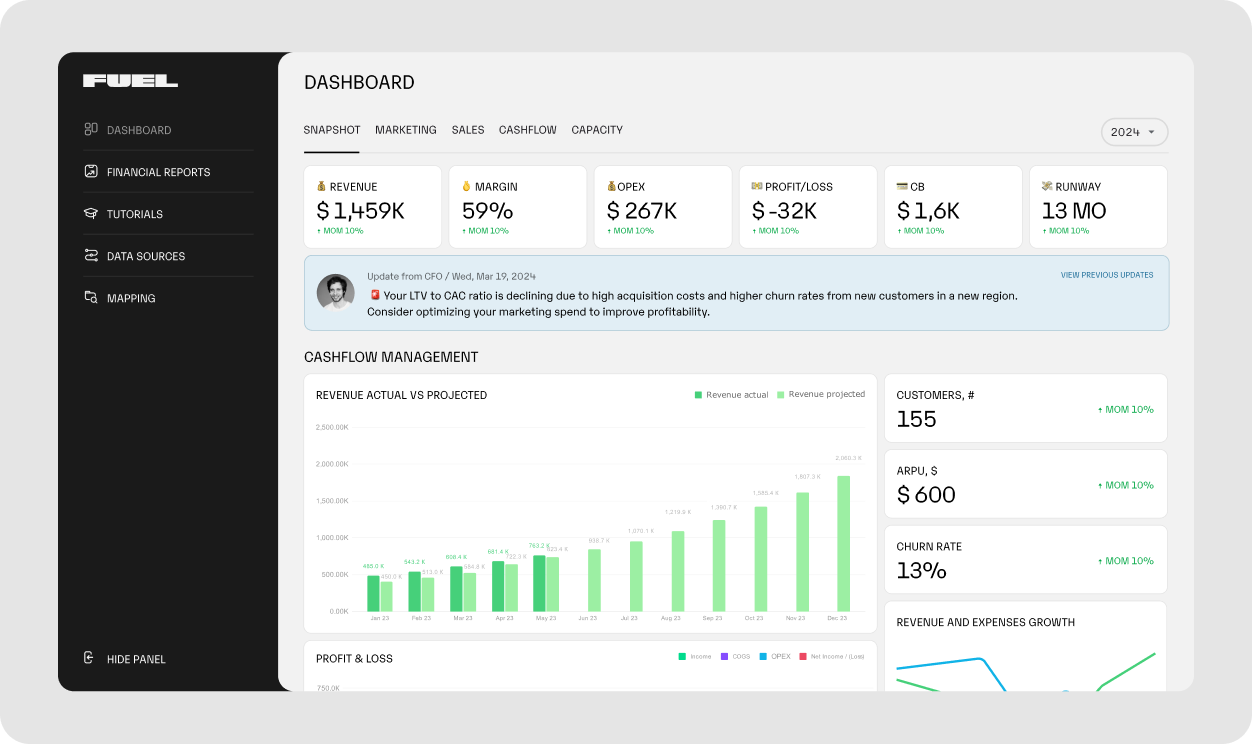
Fuelfinance is your source of truth for all financial and operational data — consolidating information from your CRM, accounting software, ERPs and more. Instead of going between platforms or juggling spreadsheets, you get centralized access to your company’s financial data in a customized dashboard.

Here are the most important financial statements that you can generate with a few clicks through our financial reporting software:

  • Profit and loss (P&L): This report outlines your company’s revenues, costs and expenses during a specific period. It calculates key performance indicators like income, gross profit, operating profit, operating expenses and gross profit margin. Fuelfinance generates detailed P&L reports using the accrual method, giving you a clearer picture of profitability over time.
    Read also: How to calculate operating profit: a cheat sheet from Fuelfinance
  • Cash flow: This shows the actual movement of money in and out of your business across three key statements: operational, investment and financial. The cash flow statement reveals your business’s liquidity and ability to meet financial obligations. Fuelfinance simplifies this by automatically tracking cash inflows and outflows, i.e., money received and spent.
    Read also: Cash Flow Forecast & Planning
  • Balance sheet: This report provides a snapshot of your company’s financial position at a specific time. It lists all assets (like cash, inventory and equipment) and liabilities (like loans and accounts payable). Fuelfinance pulls data directly from integrated systems and flags discrepancies through anomaly detection before they become issues.
    Read also: How To Forecast Balance Sheet
  • We also offer an automatic report feature, which generates financial statements for any period. Use a simple prompt — no spreadsheets or manual calculations required — and our platform will auto-generate the report you need, ready for deeper analysis or presentation.

    Here are some valuable tips for preparing financial statement reports:

  • Make sure your company's financial statements are always up-to-date. Our financial analysis software consolidates financial data from your CRM, accounting tools and ERPs, keeping your financial reports accurate and current, with little effort on your part.
  • You don’t need to be a financial analyst to understand your company’s financial position. Improve your financial literacy with our resources that help you understand terms like revenue recognition. And if you're a customer, you’ll get unlimited access to AI for finance tools and a dedicated financial manager who can walk you through your income statement, balance sheet or cash flow statement, anytime you need it.
  • Stay on top of your cash runway. This metric tells you how many months of operating money your business has left. The Fuelfinance Startup Runway calculator helps you monitor it weekly so you can make faster, smarter financial decisions.
  • These small practices make a big difference — and they’re a key part of mastering how to do a financial analysis the right way.

    Analyze your financial statements

    It’s now time to conduct a financial statement analysis. There are three techniques that we use at Fuelfinance:

  • Horizontal analysis: Compares financial data across periods to identify trends. For instance, if your net sales increased but gross profit margin dropped, your costs may rise faster than revenue.
  • Vertical analysis: Evaluates line items as a percentage of a base figure, like net sales. It’s commonly used in income statement analysis to understand cost structures.
  • Ratio analysis: Compares line-item data to evaluate financial health. Examples of ratio analysis include evaluating metrics like price-to-earnings (P/E) ratios, earnings per share or dividend yield.
  • To properly assess your financial reports, you need to be an extremely good detective or download Fuelfinance — your super detective. Here’s how we support you:

  • AI anomaly detection: If your financial ratios, profit margins or balance sheet data look off, our AI flags unusual patterns and suggests what’s worth optimizing.
  • Scenario modeling: Build multiple revenue projections — baseline, target and pessimistic — to assess your company’s growth under different conditions with our AI forecasting tools.
  • Expert help: A dedicated financial manager reviews your financial analysis report and advises on strategic decisions.
  • Consider financial metrics

    While analyzing financial statements gives you the big picture, zooming into metrics helps diagnose the specifics of your financial health. That’s a core lesson in how to do a financial analysis that generates actionable insights.

    Here are some of the key financial metrics that show your business's financial performance:

  • Burn rate and cash runway: Burn rate reveals the rate at which a company spends its capital over a specific period, whereas cash runway assesses the amount of time a company has before it runs out of cash, given its current burn rate. They are crucial for businesses in growth phases because they indicate the sustainability of current operations and how long the company can continue before needing additional funding.
  • Cost Of Goods Sold (COGS): COGS represents the direct costs of producing goods or services your company sells. It is essential for understanding the profitability of each unit sold and optimizing production processes.
  • Average Revenue Per User (ARPU): ARPU measures the average revenue generated by each user, providing insights into customer value.
  • Monthly Recurring Revenue (MRR): MRR is the total revenue your business generates on a monthly basis and is a leading indicator of future revenue and growth.
  • Operating profit: Operating profit is crucial for understanding the fundamental profitability of your business. It excludes interest and taxes, offering a clearer view of core operations. You can calculate your operating income by subtracting the COGS and operating expenses from gross profit.
  • Operating margin: This is a profitability ratio that shows the percentage of revenue left after deducting both COGS and operating expenses. You get it when you divide your operating profit by sales.
  • Tracking financial metrics regularly is harder than it sounds, especially when things get busy. Fuelfinance makes it easy, bringing all your key numbers into one place. Whether you’re looking at ARR growth, net profit, COGS or operating profit margin, everything is automatically updated and ready to review.

    This FP&A software suggests which KPIs matter most for your type of business. If you’re running a SaaS company or an agency, Fuelfinance will highlight the metrics that align with your financial model. No guesswork — just the correct data at the right time to help you make confident, informed decisions.

    Compare your plan with actual results

    The last step in our how to do a financial analysis guide is to compare forecasts with reality. You need to regularly compare your budget or forecast against actual results to measure your company's performance.

    Furthermore, you may want to share the financial analysis results with internal and external stakeholders, including management, investors or other relevant parties. 

    You can leverage your results if you're satisfied with them in your pitch deck.

    Here are some ways in which you can use Fuelfinance to make this process faster:

  • It runs plan vs actual analysis and automatically compares your forecasts and budgets with real-world performance, helping you spot what’s working or needs to be adjusted. We recommend doing this monthly for the most accurate financial forecasting.
  • Fuelfinance presents your plan vs actual results in customized dashboards that make trends and gaps easy to understand.
  • Your dedicated financial manager is also part of the process — using your financial data to suggest the right KPIs, customize modeling based on your business model and help you translate the insights into strategic action.
  • Why you need Fuelfinance for financial analysis

    Performing a financial analysis is complex, especially when you’re wearing multiple hats as a founder or managing multiple teams as a CFO.

    That’s exactly why Fuelfinance exists. We’re more than a financial analysis tool — we’re your outsourced finance department. Our software automates repetitive tasks, and our experts work alongside you to provide ongoing strategic insights.

    Here’s a brief summary of what you get in the package:

  • Centralized reporting: Sync data from over 350 tools, including CRMs, ERPs and accounting software, into one dashboard, so you always work from a single, reliable source of financial truth with all your financial statements.
  • Financial analysis and scenario planning: Understand where your money is going and where it should go next. This feature helps you uncover spending trends, align them with revenue goals and build budgets. It generates forecasts that help you plan for growth, challenges or anything.
  • AI forecasting: Use AI to forecast revenue, expenses and cash flow with high accuracy. As new data flows in, your projections automatically adjust — giving you an up-to-date financial outlook that reflects real-world performance.
  • Want to feel confident about your financial analysis finally? Book your free demo and see Fuelfinance in action.

    Ready for financial peace of mind?

    If you're a founder, CFO or CEO, you already know how important it is to stay on top of your numbers. But between revenue pressure, rising costs and limited internal resources, financial analysis often gets pushed aside.

    Fuelfinance gives you the structure, tools and expert support to take control (and teaches you how to do a financial analysis correctly!). Everything you need from real-time dashboards and auto-generated reports to AI forecasting and scenario modeling is in one platform — built specifically for companies like yours.

    You don’t need to build an in-house finance team to get clarity. Start using Fuelfinance to get powerful automation and dedicated guidance that scales with your business.

    Book a demo, and let's work together toward achieving your financial goals.

    FAQs

    How do you perform a financial analysis?

  • Gather relevant data, such as income statements, cash flow statements and balance sheets. 
  • Analyze the data and calculate financial ratios such as burn rate and cash runway, operating profit etc.
  • Compare your original plan with your actual results, considering external factors and industry trends and draw conclusions that will help you improve your financial management in the future. 
  • If this seems overwhelming, you can always hire a fractional CFO to help you create a financial analysis report.

    What is a financial analysis example?

    For example, a company’s financial analysis could include examining its income statement and balance sheet to assess its revenue, expenses and profit margins. It could also involve calculating different financial ratios, for example, burn rate, that would provide insights into business performance and assess financial risks.

    What are the 5 methods of financial statement analysis?

    There are many different methods for effective financial statement analysis, but here are the most common ones:

  • Horizontal analysis
  • Vertical analysis
  • Ratio analysis
  • Cost-volume-profit (CVP) analysis
  • Trend analysis
  • How do I start learning financial analysis?

    The first step is familiarizing yourself with financial terms, financial statements and ratios. You should then learn how to create different spreadsheets, use formulas and analyze data with the help of financial analysis software. Our blog is a great place to start as we write in a way that's easy to understand, even though you're not a finance professional. You can start with this article on managing finances in a startup.

    More posts